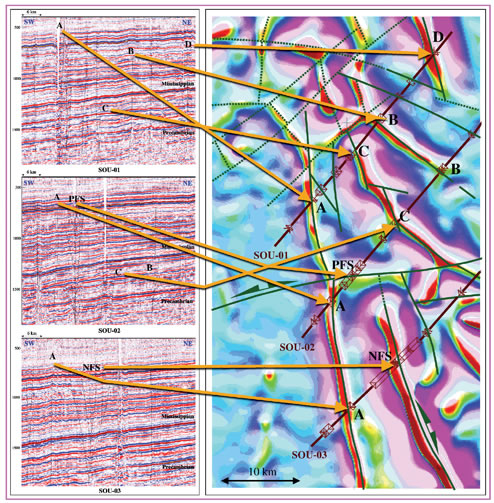
Figure 2. The map on the right shows a shallow filter of the HRAM data (reds are highs and magenta colors are lows). Seismic lines are shown in dark brown, and the fault locations as picked on a seismic workstation are indicated. Panels of seismic lines SOU-1, 2 and 3 are shown on the left, with interpreted faults labeled by letters A-D and PFS (positive flower structure) and NFS (negative flower structure).