Click to view article in PDF format (~4.9 mb).
3D Field Modeling of Algerian Glacial Ordovician Reservoirs*
By
Lena Dauphin1, Angelique Martin1, and Guy Desaubliaux2
Search and Discovery Article #40260 (2007)
Posted October 1, 2007
*Adapted from extended abstract prepared for presentation at AAPG Annual Convention, Long Beach, California, April 1-4, 2007
1Gaz de France E&P Division, Paris, France ([email protected])
2Institut Français du Pétrole, Rueil Malmaison, France
One of the key challenges in the exploration and exploitation of hydrocarbon reservoirs lies in a detailed and realistic understanding of the shape, size, and spatial distribution of the reservoir and non-reservoir subsurface features.
A 3D geological model of the siliciclastic Cambro-Ordovician reservoirs of an Algerian gas field was built for purposed of reservoir simulation and reserves estimation. This model is based on the integration of all available seismic and well data, as well as outcrop analogue models.
To build such a realistic 3D model, geological knowledge of the sedimentary architecture is fundamental. The Ordovician reservoirs are made of glacial to periglacial deposits organized in several erosive units. The sedimentological study was performed in collaboration with IFP (Institut Français du Pétrole) and was presented in an associated poster.
Data inputs for the geocellular model consist of standard structural and reservoir unit thickness maps, but also more specific sedimentary facies distributions, well correlations, and geometrical organization typical of glacial deposits. Simulation methods were also used to produce a deterministic base case that fits both the subsurface data and the sedimentological model.
Petrophysical ranges associated with each unit or facies, and deduced from core and log data, appear to be clearly related to the deposit features themselves. This point confirms that the sedimentological model remains a key driver to the understanding of these reservoirs and also brings valuable QC to the integration of "hard" and "soft" data.
|
|
Gaz de France Exploration Algeria, operator, and Sonatrach, are partners on blocks 352a and 353 in the Sbaa Basin of SW Algeria. In this basin, the main gas levels are the Cambrian and Upper Ordovician reservoirs, sealed and sourced by the Silurian “Hot Shales” Formation. During the exploration and appraisal phases of the project, a drilling program, including coring, standard logging, and imaging (FMI), accompanied by a 3D seismic campaign, supplied significant amount of new data which completed the already available dataset on the area. One of the keys in the exploration and production of hydrocarbon reservoirs lies in the understanding of the shape, size, and spatial distribution of the reservoir and non-reservoir subsurface features. The final challenge is to be able to formalize the geological knowledge in 3D geological and reservoir models. It is therefore fundamental to integrate properly all the available data from wells, seismic, and outcrop analogues. An important, integrated sedimentological study has been carried out to predict the distribution of high- and low-permeability sands, as well as the occurrence of silty intervals.
The Sbaa Basin is an intracratonic, NW-SE-elongated basin, located in the middle of the Saharian-Gondwana craton (Figure 1). During the Early Paleozoic times, the sedimentation pattern of the Gondwana craton was characterized by a stable tectonic regime and a very low sedimentation rate (approximate 12 m/My.) while a large wave-length and low-amplitude flexural deformation generated some intracratonic sub-basins, separated by arches forming highs on which sedimentary series thinned. Evidence of onlaps and truncatures of the Cambro-Ordovician succession can be seen, suggesting that vertical tectonic movements were affecting the area during the sedimentation. These Cambro-Ordovician deposits (around 600m of sediments) are locally pinching out, onlapping the base Cambrian unconformity. The onlap was sealed by the Silurian shales, and the lower Devonian succession was apparently not affected anymore by this syn-sedimentary tectonic movements. The Hercynian tectonic phase is responsible for major basin inversion and the formation of most structural traps in the area. Cambrian and Lower Ordovician deposits correspond to fluvial systems characterized by braided-type, sand-rich channels laterally migrating in a basin-wide braided plain. At the end of Ordovician times, the Gondwana supercontinent was situated close to the South pole (Figure 2). The Upper Ordovician (Ashgillian) is characterized by an atypical major glaciation with a minimal duration of 400 ky and the development of an ice cap spreading over a surface twice as large as the present Antarctic. This glaciation was responsible for successive glacial erosion events leading to a major sedimentary discontinuity, which is recorded at the whole continental scale. From the Silurian, as a consequence of climatic warming, melting of the ice sheets resulted in a rapid transgression marked by the Silurian “Hot Shale” deposits.
Sedimentological Model The sedimentological model focuses on the Upper Ordovician glacial deposits, which are the main gas-bearing reservoir of the studied field. All the facies associations described for these deposits are typical of the strong glacial climatic signature of this period. Several phases of ice retreat and advance have been identified. Each glacial unit is defined by a cold phase responsible for the main erosive boundary surfaces, an early warming stage corresponding to a rapid extension of the ice cap before retreating (Gilbert deltas, ice-contact deposits, etc.), a melting stage which produced the main volume of sediment (mostly glaciomarine megaripples systems), and a poorly preserved interglacial stage representative of shallow-marine various environments. (Figure 3). Several outcrop studies, combined with an extensive subsurface study (core descriptions, log, and seismic-data interpretation), led to a facies partitioning of the glacial sequences (Figure 4). The ice-contact deposits correspond to very coarse, poorly sorted material deposited with a very high flux of water and sediment during the early stage of warming. The emerged part of the system, where preserved and observed, is composed of high-energy/poorly channelized fluvial systems corresponding to the outwash plain in front of the ice cap when grounded. During the melting phase, the major part of the sediments was deposited in a marine channel/levee/lobe megaripple system organized in backstepping units. The distal part of the system is composed of abundant marine, silty shales characterized by the presence of more or less abundant dropstones. Interglacial shallow-marine sediments are rarely preserved. From facies and wireline electrofacies identification for each well, four glacial units have been defined, correlated, and mapped, showing a complex infill of valley-like network (Figure 5).
In such heterogeneous reservoirs, a detailed sedimentological model is required to represent a realistic reservoir architecture. In our case study, presented here, seven wells were used, four of them having been drilled during the current exploration and appraisal phase of the project.
After data loading and gridding, the first important step is the modeling of facies. Each glacial Unit has been modeled respecting the isopach map produced from the above sedimentological model and well correlations (Figure 6). Two methods are used for facies modeling. First, as a background model, a pixel approach by SIS (Sequential Indicator Simulation) was used, allowing one to set a facies distribution with external drifts and employing histograms and directional parameters (variograms, probability of occurrence, 2D vertical and horizontal trends). Then, for discrete bodies (channels/levees, Gilbert deltas), object modeling is used, dimensioned by outcrops analogues. This led to a deterministic base case that fits both the subsurface data and the sedimentological model.
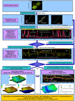
Petrophysical ranges are computed from core and log data for each unit and facies. Porosity is modeled through truncated normal laws. The final model appears to be clearly related to the features of the deposit themselves (Figure 7), so high porosities depend on the distribution of the “good” facies.
The modeling of the distribution of permeability and saturation within the geological model has been performed on an iterative process. When sorted by facies, it is possible to correlate porosity with permeability (“Phi-K relationships”). In parallel, saturation equations were built, using only the permeability and porosity as inputs (Figure 8). It is therefore possible to simulate for each well permeability and saturation profiles knowing the well facies and porosity distribution.
In the next step, Phi-K relationships have been adjusted in an iterative process so as to:
Once the best fit has been obtained, the final Phi-K relationships per facies were used to populate the geological model with permeability. The saturation was then calculated on the basis of the distribution of petrophysical parameters and a set of saturation equations. This methodology eases considerably the matching of the reservoir model to dynamic data as long as matrix permeability is the main driver to explain the reservoir productivity. In particular, it gives hints and limits for the final adjustment of permeability. Finally, the methodology allows one to reconcile saturation and permeability to porosity and facies consistently and enables reliable computation of the volume of gas initially in place.
Geological and reservoir models confirm that the sedimentological model remains a key driver to the understanding of these reservoirs, and it also brings valuable quality control to the "hard" and "soft" data integration.
Cocks L.R.M., and Torsvik, T.H., 2002, Earth geography from 500 to 400 million years ago: A faunal and palaeomagnetic review: Journal of the Geological Society of London, v. 159, p. 631-644. WEC Algerie, 1995, Well evaluation conference: a compilation of studies carried out by Sonatrach staff and published in association with Schlumberger-France: Schlumberger, 354 p.
The authors would like to thank Sonatrach and Gaz de France for their constant support and advice.
|