Click on image to view enlargement.
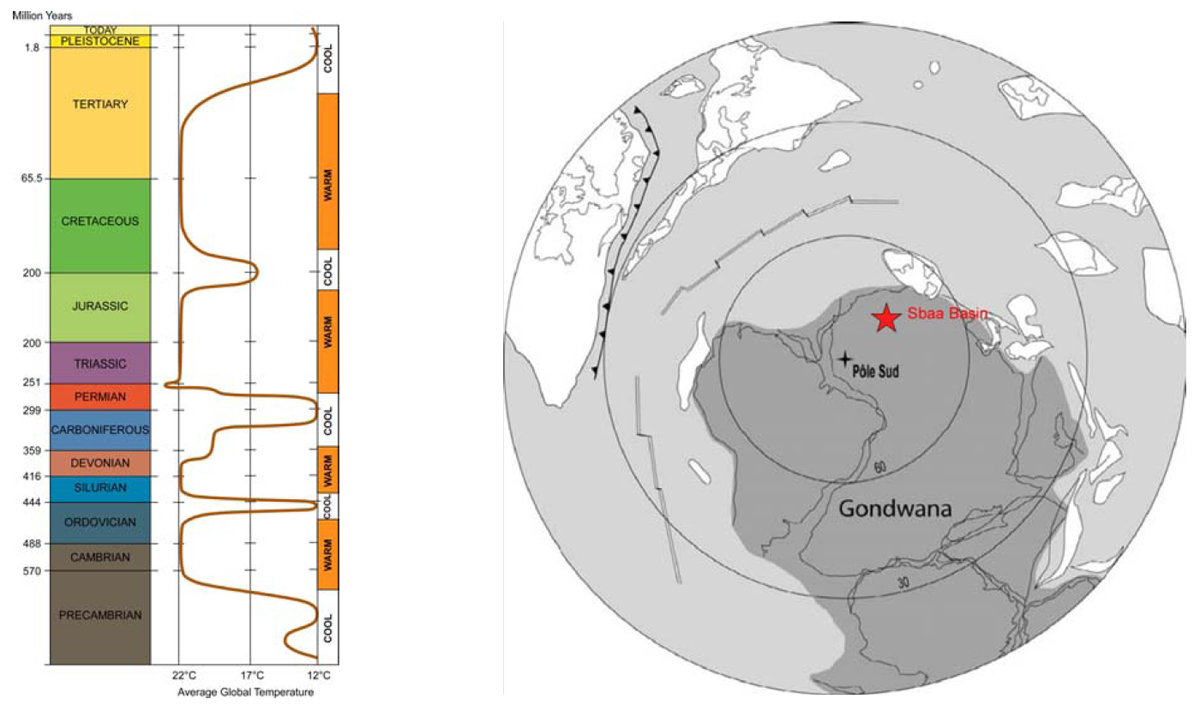
Figure 2. Left: Climatic changes in geological times. Right: Paleogeographical map showing the south pole position on the Gondwana supercontinent in Late Ordovician. The dark grey area reflects the maximum ice-cap extent. (After L.R.M. Cocks and T.H. Torsvik, 2002.) 2007 AAPG Annual Convention and Exhibition;