Click
to view article in PDF format.
Click
to view article in PDF format.
Unconventional analytical techniques for unconventional gas: A case study of a Late Cretaceous–Tertiary Ardley gas-charged coal in the Pembina – Warburg Exploration Area, Alberta, Canada*
By
Shane M. Harrison1, T. Gentzis2, and M. Payne2
Search and Discovery Article #40222 (2006)
Posted November 10, 2006
*Adapted from extended abstract prepared for presentation at AAPG Annual Convention, Houston, Texas, April 9-12, 2006
1SH Consulting Services, 202, Calgary, AB, Canada([email protected])
2CDX Canada Co., 1210, 606 - 4th Street SW, Calgary, AB, T2P 1T1, Canada
A regional exploration effort in west-central Alberta was undertaken within an approximately 15-17,000 km2 area designated as the Pembina-Warburg Block (Figure 1).
The exploration Block encompassed all or parts of Township 35 to Township 52 and Range 25 W4M to Range19 W5M (latitude 51.97 - 53.54 / longitude 116.78 - 113.40). As part of the program a key test-well was drilled in the east-central part of the block at 8-10-047-04 W5M, where a relatively shallow (ca. 200 m deep) and thick coal seam was targeted (Figure 2). The coal was assigned to the uppermost part of the Scollard Formation and lies within the upper part of the Ardley Coal Zone (ACZ).
The principal objectives of the program were to (1) evaluate the hydraulic character of the Ardley coal including the collection of representative samples of formation fluids, pressure data, and coal permeability, (2) evaluate how these data may be used to evaluate producibility, and (3) evaluate the regional hydrogeological setting of the ACZ.
|
|
Well Completion and Testing Program The Ardley coal target was reached at a drilling depth of approximately 200 m bgs. The test-well was drilled and completed using an air-rotary mounted drill rig with a Class 1a BOP system. An intermediate steel casing interval was set and cemented to the top of the Ardley coal, effectively isolating the coal zone from overlying beds. The 9-m-thick coal zone was then air-drilled, reamed, and left open-hole, minimizing potential formation damage from drilling and completion fluids. Drilling was terminated within the coal. The test-well was then allowed to re-equilibrate to static pressure for a period of approximately 80 hours. The test-well was then equipped with a downhole submersible pump, tubing, wiring, and monitoring devices (Figure 2). Testing consisted of a pump-off (drawdown) and build-up (recovery) of pressure head (water). Pressure was decreased by pumping formation water at a constant rate of approximately 18 L/min (26m3/day). Dynamic pressure levels (i.e., hydraulic head) were measured at specified intervals throughout the drawdown (depressurization) period and subsequent recovery period (pressure build-up). Pressure drawdown in the test-well was carried out for approximately 120 minutes. The recovery (pressure build-up) phase followed for a period of approximately 5500 minutes to reach static pressure (Figure 3). Drawdown and recovery data compiled from the test-well were evaluated using log-log and semi-log methods illustrated by Horne (2000) and described for single-phase (water) flow by Theis (1935) and Cooper and Jacob (1946). The Theis (1935) and Cooper and Jacob (1946) equations were used to relate transmissivity (and permeability) of the formation to the pumping rate and change in dynamic water level, for late-time pressure build-up data (i.e., water phase). The testing method also permitted a detailed hydrochemical sampling program to be undertaken during the drawdown and following the build-up phase of the testing. The sampling and analytical program were designed to provide information on formation fluids, including major ion composition, regulated monocyclic aromatic hydrocarbons, dissolved metals, dissolved gas composition, and oxygen, hydrogen, and carbon isotopes of the fluids and dissolved gases.
Downhole measurements showed a build-up of fluid (water) pressure within the coal to approximately 1470 kPa (slight underpressuring). Drawdown of the fluids showed that the permeability of the coal is less than 5mD and likely less than 1 mD. Formation waters are Na-HCO3 type with salinities of approximately 1920 mg/L TDS (calculated). Detailed isotopic analyses of the fluids showed anomalously high bicarbonate concentrations of up to 1650 mg/L characterized by enriched d13CDIC of +22.50 ‰. Dissolved methane concentrations of up to 36 mg/L are characterized by depleted d13CCH4 of -48.32 ‰. Formation fluids d18O and d2H plot along the local groundwater line (LGWL) for Edmonton, Alberta, suggesting a meteoric origin (Figure 4). The 13C isotopes for DIC and CH4, coupled with 18O and 2H isotopes for associated groundwater and regional hydraulic / hydrochemical data, suggest that the uppermost Ardley in the eastern part of the study area is part of a regional, topographically driven, dynamic flow system in which methanogenic processes are gas charging the coal and modifying groundwater chemistry in parts of the exploration area (Figure 5).
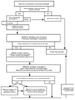
Well Testing Results - Implications for Production The pressure data coupled with the physical evidence of the hydraulic testing indicate that depressurization of coal zone by at least 1225 kPa (125 m of drawdown) will be required to reach a critical desorption pressure. Zone depressurization will be affected by the low permeability of the coal to the water phase which will lead to the development of a steep and narrow drawdown cone (depressurization cone) as illustrated in Figure 6. Simplistically, gas production rates will be a function of an appropriately designed depressurization system and, more specifically, a system which will permit a contiguous volume of coal to be depressurized, thereby optimizing gas desorption and production (Figure 6). Depressurization or production schemes which include horizontal pinnate patterns would likely prove most effective in depressurizing the zone but likely would be a more expensive production option. As evident from the depressurization in the test-well data, a comparatively small volume of produced water can be expected from the coal zone. Assuming all other factors remain equal, cumulative fluid production will be directly related to the total volume of rock (i.e., coal) depressurized. Note that well stimulation (e.g., “fracing”) techniques may lead to increased water production, particularly if overlying or underlying water-bearing units with higher permeability (e.g., sandstones) are affected. Given that the fluids within the zone are characterized by salinities of less than 4000 mg/L (nonsaline), the coal zone lies within the Zone of Groundwater Protection as defined by the EUB (1995) and, under current regulatory guidelines, a “Preliminary Groundwater Assessment” or PGA as defined by Alberta Environment (2004) would be required to further evaluate the zone. The PGA, required as part of the process for authorization to divert fresh water (i.e., depressurize the zone), consists of the main elements shown in Figure 7.
Alberta Energy and Utilities Board, 1995, Alberta’s Useable Groundwater Database. Alberta Environment, 2004, Alberta environment guidelines for groundwater diversion for coalbed methane / natural gas in coal development. Cooper, H.H., and C.E. Jacob, 1946, A generalized graphical method for evaluating formation constants and summarizing well field history: American Geophysical Union Transactions 27, p. 526-534. Horne, R.N., 2000, Modern Well Test Analysis: A Computer Aided Approach: Petroway Inc. Palo Alto, Calif. International Atomic Energy Agency / World Meteorological Organization (IAEA/WMO), 2001, Global network of isotopes in precipitation. The GNIP database. Accessible at http://isohis.iaea.org/gnip.asp. Edmonton Station, updated September 2002. Theis, C.V., 1935, The relation between the lowering of the piezometric surface and the rate and duration of discharge of a well using groundwater storage: Transactions of the American Geophysical Union 2, p. 519-524. |