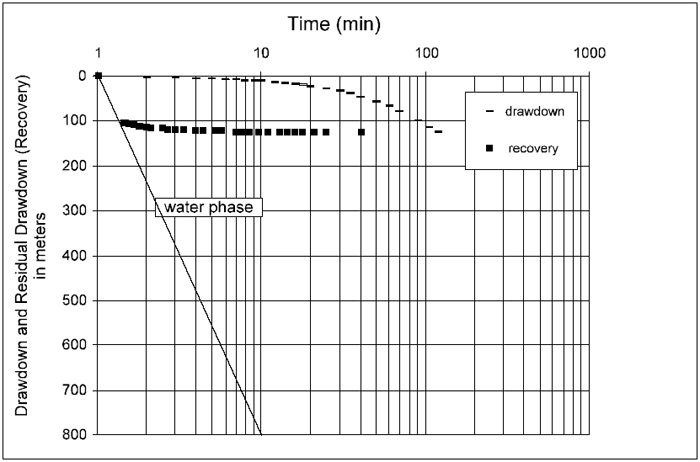
Figure 3. Pressure build-up / recovery in test-well. Late time data are interpreted as water phase and are used to estimate transmissivity and permeability with Cooper – Jacob semi-log methods (T=2.3Q/4*•*•s).
Pumping Rate = 26m3/day
Non-pumping Water Level (static pressure) = ca. 50.5 m (BTOC)
Available Drawdown (Hydraulic Head) = ca. 150 m
•s drawdown over one log cycle = 800 m
Thickness of coal zone (and completion) = 9 m
Conversion factor to mD = 9.66X10⁻⁹