Click on image to view enlargement.
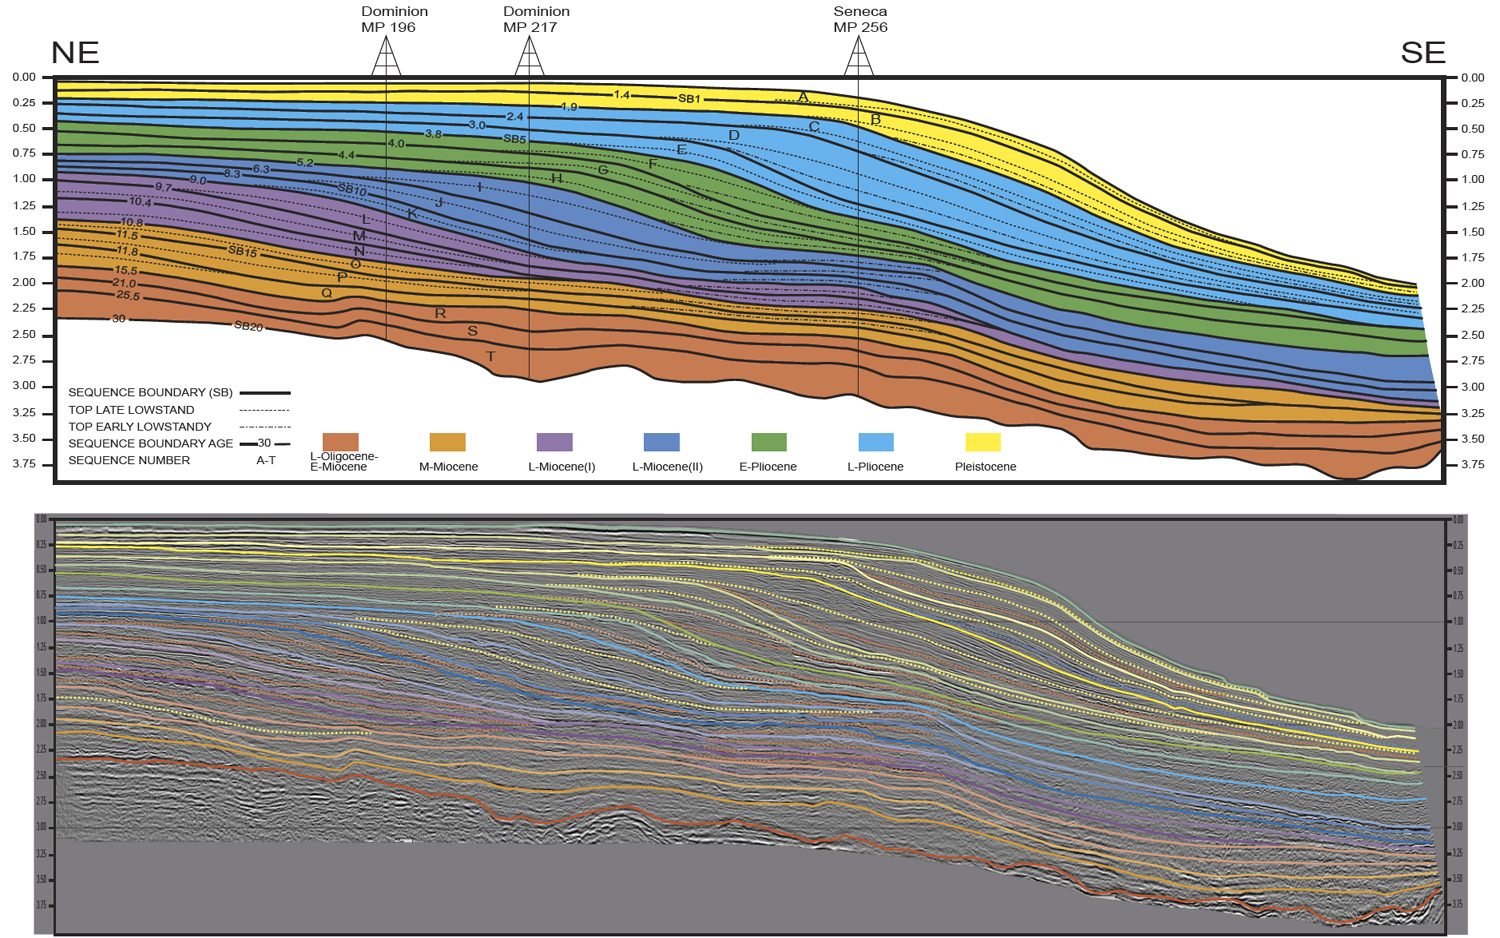
Figure 2. Line drawings of interpretation together with interpreted profile. Location of profile is shown in Figure 1. Sequences (A-T), sequence boundaries (1-20); systems tracts (ELST, LLST, and HST) and their boundaries are also shown.