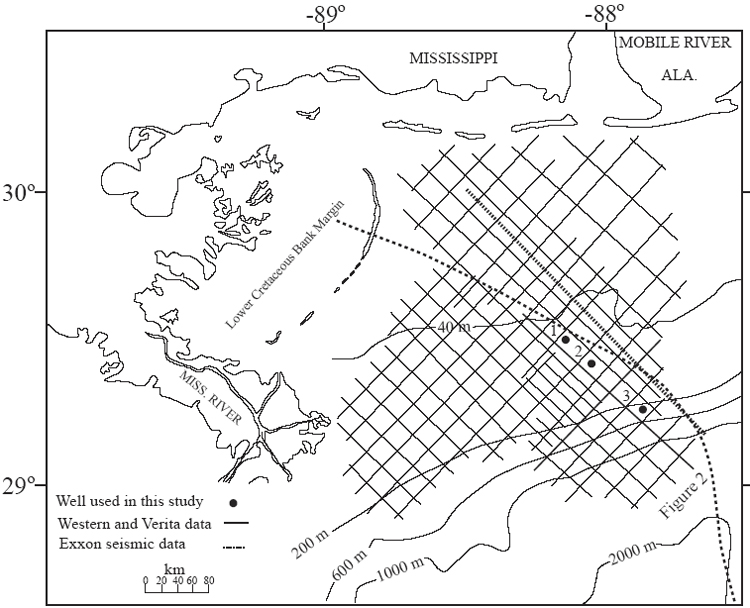
Figure 1. Location map. Wells used in this study are: 1) Main Pass Dominion 196; 2) Main Pass Dominion 217; and 3) Main Pass Seneca 256. The heavily dashed line, running NW-SE, is an Exxon seismic profile used by Greenlee (1988) and Wu and Vail (1990). The curved dashed line is the Lower Cretaceous Bank Margin. Location of Figure 2 is also shown.