PSThe Sequence Stratigraphy, Depositional Environment and Reservoir Characterization of the Taylor Sandstone at Woodlawn Field, Harrison County, East Texas*
By
Jennifer Hoyt1
and Floyd "Bo" Henk2
Search and Discovery Article #20039 (2006)
Posted October 16, 2006
*Adapted from poster presentation at AAPG Annual Convention, Houston, Texas, April 9-12, 2006
Click to view posters in PDF format.
Poster 1 (~6.2 mb) Poster 2 (~5.8 mb) Poster 3 (~1.8 mb)
1
University of Texas at Dallas, Murphy, TX ([email protected])
2 Matador Resources, Dallas, TX ([email protected])
Abstract
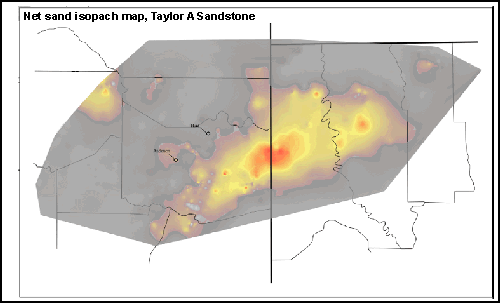
This study uses core descriptions, well log responses and porosity calculations to determine the depositional environment, correlation lengths, and potential reservoirs of the Taylor Sandstone in the Cotton Valley Group. Eleven facies are described from 562 ft (171 m) of core. The Taylor Sandstone is divided into three individual sand bodies, the Taylor A, B and C Sandstones, and correlated to produce net sand isopach maps. The net sand isopach maps show the morphology of the thick and thin sand intervals. The net sand isopach maps and facies descriptions are used to interpret the depositional environment of each interval.
The Taylor Sandstone is determined to represent a dynamic environment that has a high degree of reworking due to the transgression-regression pulses that are present. The Taylor C Sandstone is described as a wave-influenced delta. The Taylor B Sandstone shows lobe switching of this delta to occupy the low deposition areas left by the Taylor C Sandstone. These intervals are then buried by a transgressive pulse which allows for the deposition of a thick shale unit. The Taylor A Sandstone shows the progradation of another delta before it is covered by oyster-rich marine shale, the Dirgin Shale, upon the final transgression.
The porosity measurements show that grain size is the main control on porosity. Carbonate cement can reduce porosity and intense bioturbation that is prevalent throughout the interval can help retain porosity with burial. Porosity mapping shows that porous intervals in the Taylor Sandstone can be mapped on a field scale. There is further potential for production from the Taylor Sandstone interval within the thick sandstone areas that are depositionally linked - which can be discovered using net sand maps and the characterization of facies from core descriptions.
Selected Figures
