Click on image to view enlargement.
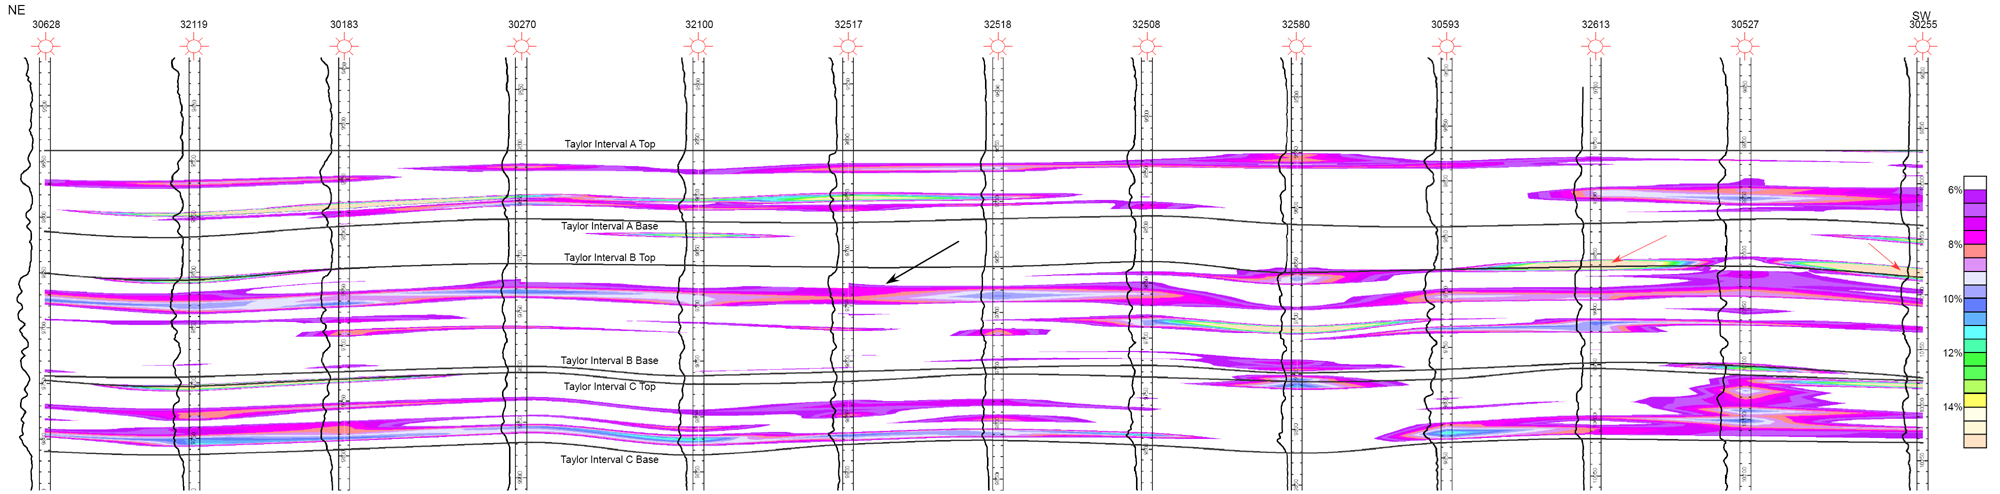
Cross section, Woodlawn Field, showing distribution of sandstone units and their porosity in each well (colors representing values between 6% and 15%). Overall, the B interval has the best porosity; the C Interval is second; whereas the A interval has the poorest porosity.