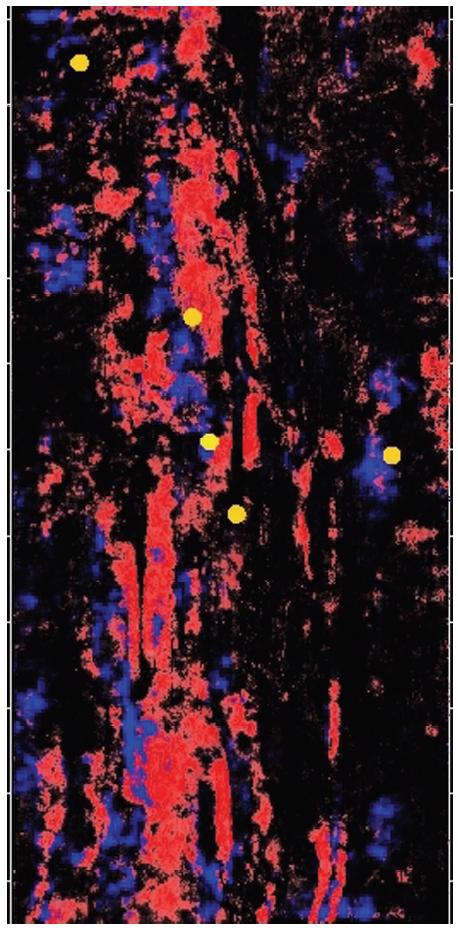
Figure 3. Top down view of a volume-rendered, opacity-filtered, 20 ms thick slab around 2,100 ms illustrates the lateral continuity and extent of the flat spot shown in Figure 2. The five wells (yellow dots) drilled for the deeper target missed the flat spot, even though it covers about 20 percent of the survey, or 60 square kilometers. It appears as if the flat spot should continue off the southern and possible northern ends of the survey.