![]() Click to view presentation in PDF format.
Click to view presentation in PDF format.
Lessons Learned from Failures
Bypassed Pays: Opportunities For Large Reserve Additions*
By
Robert M. Sneider1, Larry D. Meckel2, and David G. Smith3
Search and Discovery Article #20022 (2004)
*Adapted from the oral presentation by the senior author at the History of Petroleum Geology Forum: Lessons Learned from Failures, AAPG Annual Meeting, Dallas, April 18, 2004.
1R.M. Sneider Exploration, Houston, TX ([email protected])
2 L.D. Meckel and Company, Denver, CO ([email protected])
3 Burlington Resources Ltd., Calgary, Alberta, Canada
Abstract
Significant hydrocarbons have been found in wells previously considered dry or uneconomic. The supergiant Elmworth field in western Canada and low-resistivity reservoirs in giant fields in Africa and Asia are examples. The Elmworth field is in the Alberta basin syncline, northwestern Alberta and northeastern British Columbia. Prior to discovery in 1976, 61 dry or uneconomic wells were drilled through or into Lower Cretaceous clastics that are now productive. Over 2000 producing wells develop 10 principal reservoir units with reserves of over several 10s of TCF of gas. The field is a large stratigraphic trap with gas-saturated section over 65 miles long, 30 miles wide, and up to 723 feet thick. Major reservoirs are delta front and channels, coastal barrier and marine bars, and alluvial fans. Sandstones have porosities of 7 to 10 percent and permeabilities of 0.01 to 10 millidarcies (md). Conglomerates and coarse sandstones have porosities of 3 to 8 percent and permeabilities of 0.1 to 80 md. Reservoir units are gas-saturated and are lower pressure and tighter than their updip, more porous, water-bearing equivalent units. Integrated geological-petrophysical –reservoir engineering studies utilized rock-fluid data from cuttings, cores, logs, and drill-stem and production tests to determine reservoir-rock potential and hydrocarbon saturation. Well logs and rock data were studied (1) to identify depositional trends, especially of the more permeable reservoir and (2) to map areas of the highest gas volumes which guided the price bid on land and to identify the most productive areas. Integrated geoscience-petroleum engineering studies using similar methodology as Elmworth have led to discoveries in low-resistivity reservoirs in giant fields in new and mature basins in West Africa and Asia.
|
|
Some Common Reasons for Failures
Effect of conductive minerals (clays, pyrite) Incorrect Archie “m” and “n”
West Africa Giant
Field
|
|
|
|
|
|
|
|
|
|
|
|
|
|
|
|
|
|
Figure 6. Clay-coated sand contributes to the high water saturation in the hydrocarbon-bearing reservoir. |
|
|


This prospect became a billion-barrel oil and condensate field that was almost missed. The first well (Figures 1 and 2) was temporarily abandoned after the water saturation of the objective sand was considered to be indicative of a water-wet reservoir. No other zones were considered of interest. The second well (Figures 3, 4, and 5), in a separate fault block, proved to be highly productive, as did four other appraisal wells (Figure 7).
Summary of Reservoir Features
Evaluation of “M” Sand, Well 1, Prospect “C”
28.3 m Gas over Water
Porosity: 27 – 34%
Water Sat.: 64 – 81%
Tests:
None
No Other Zones of Interest
Temp. Abandoned;
Not Economic
Evaluation of “M” Sand, Well 2, Prospect “C”
17.2 m Gas + Condensate
6.4 m Oil to Sand Base
0.0 m Water
f and Sw as in Well 1
Tests:
High Flow Rates
6 Other Low-Resistivity, Low-Contrast (LRLC) Zones
Est. Recoverable Reserves:
1.03 Billion Barrels of Oil and Condensate
Evaluation of Well No. 2, “M” LRLC Sand,
Prospect “C”, Offshore West Africa, in comparison to Well No. 1.
Well No.
1 Well No. 2
Porosity (%) 26 – 32 26 – 32
Microporosity (%) ND 5 – 6
Water Sat. (Sw, %) 63 – 75 63 – 74
Irreducible Water ND 17 – 19
Saturation (Swirr, %)
Tests None; High Flow of
Well TAed Hydrocarbons
Archie Parameters Used to Calculate Hydrocarbon Saturation, “M” Sand, Prospect “C”, Offshore West Africa
Well 1 (Initial) Well 1 (RMS)* Well 2 (RMS)*
m 1.9 1.50 1.50 - 1.55
n 2.0 1.60 1.55 - 1.65
a 1 1 1
----------
*From “Rock Catalog”
Evaluation of “M” Sand Evaluation of “M” Sand
Well 1, Prospect “C” Well 2, Prospect “C”
28.3 m Gas Over Water 17.2 m Gas + Condensate
Porosity: 27 – 34% 6.4 m Oil to Sand Base
Water Sat.: 64 – 81% 0.0 m Water
f and Sw as in Well 1
Tests: Tests:
None High Flow Rates
No Other Zones of Interest 6 Other LRLC Zones
Temp. Abandoned;
Not Economic Est. Recoverable Reserves:
1.03 Billion Barrels of
Oil and Condensate
Elmworth Supergiant Gas Field, Alberta – British Columbia Deep Basin
Figure Captions (8 and 9)
Leading Comment
This supergiant field was originally missed; in fact, 61 dry holes, or uneconomic wells, were drilled prior to discovery.
Summary of Features, Elmworth Field
-
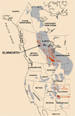
Supergiant field in Alberta – British Columbia basin syncline (Figure 8)
-
A large stratigraphic trap with a gas-saturated section over 720 feet thick, over 65 miles long, and 30 miles wide
-
Over 2000 producing wells develop 10 major reservoir units containing several 10s of TCF gas.
-
Reservoirs are delta front and channels, coastal barrier and marine bars, and alluvial fans and channels.
-
Sandstones have porosities of 7 to 11%, permeabilities of 0.01 to 10 md. Conglomerates have porosities of 3 to 8%, permeabilities of 0.1 to 80 md.; some permeabilities are greater than 1 darcy.
-
Reservoir units are gas-saturated, and are lower pressure and tighter than their updip more porous, water-bearing equivalent units.
-
Prior to discovery in 1976, 61 dry or uneconomic wells were drilled into or through Lower Cretaceous clastics that are now productive.
-
Canadian Hunter Exploration Ltd. was formed in 1973; Sneider – Meckel was formed in 1974.
-
Early Discovery History
September, 1975--Reentry to the Cadotte Formation: Uneconomic flow
November, 1975--Reentry and frac at Town: 2 MMcfgpd.
January, 1976--Drilled into porous Fahler Conglomerate: 26 MMcfgpd.
Log Analysis showed gas in very sand from 2500 to TD at 10,000 feet.
-
From 1976 to 1980, Reentries and new wells demonstrated a gas-saturated area 100 miles by 50 miles in Alberta, 17 Cretaceous reservoirs in the basin center. Area rimmed by updip water. Trend extends into British Columbia.
-
5,000 square-mile Alberta Deep basin contains low-permeability reservoirs with local high-permeability shoreface/beach conglomerate zones. This is a a huge stratigraphic trap with tens of Tcf of reserves and gas-in-place resource.
-
Wells flowed from 1 to 30 million cubic feet of gas per day; frac stimulation needed on most zones for economic production.
-
Burlington Resources purchased Canadian Hunter in December, 2001.
-
Explore mainly for gas assuming higher future gas prices and development of better well completion and stimulation technology.
-
Use a mining principle: Low-grade ore deposits have far greater total reserves than high-grade deposits (the resource triangle) (Figure 9).
-
Reexamine well logs of uneconomic wells and dry holes for hydrocarbon shows and better rock types in areas containing many wells (regional scans).
-
Integrate geological, petrophysical, reservoir engineering, and completion/stimulation concepts and technology to understand why a well was interpreted to be dry or uneconomic.
Geology: Structure and Stratigraphy (Figures 10, 11, 12, 13 and 14)

Rock Typing: Permeability, Archie “m” and “n”, Clay Type, Amount, and Distribution
Figure Captions (15, 16, and 17)
|
|
|
|
|
Figure 16. Pore-type comparators for three Alberta basin producing formations. |
|
|
Figure 17. Preparation of pore-type comparators: laboratory tests. |

Binocular Microscopic Examination (10-50x) of Cuttings* (Figures 15, 16, and 17)
-
Estimate total porosity, microporosity, permeability, Archie “m”.
-
Estimate type, amount, and distribution of clay minerals.
-
Estimate type, amount, and distribution of non-clay, conductive minerals (e.g., pyrite).
-
Estimate capillary curve and irreducible water.
-
Estimate grain size and sorting.
----------
* Tie to rock catalogs
Log Analyses
Figure Captions (18, 19, 20, 21, and 22)
Well Log Search For Bypassed Pay
1. Regional scan: “eyeball” scans (pattern recognition of porosity and resistivity logs).
2. Select wells for further analysis on land unleased.
3. Exploration phase: these wells undergo more sophisticated analysis by hand calculations. Drillstem tests, water analysis, information on water resistivity, rock type information are incorporated into the log analysis.
4. Prospect development phase: porosity, water saturation, permeability, lithology, pore space properties,and clay content are compared to data from surrounding wells.
5. When a well is drilled, analysis continues. (Well is either a re-entry or a new twin well.)
6. After completion, production logging is used to pinpoint productive and non-productive zones.
Pressure Profiles (Figures 23 and 24)
|
|
Figure 23. Pressure-depth plots: Conventional vs Deep basin gas traps (after Gies, 1984). |
|
|
Figure 24. Pressure-depth plot: Cadotte Formation, Deep basin (after Davis, 1984). |

Seal and Trap (Figures 25 and 26)
|
|
Figure 25. Gas–water transition at trap edge (modified after Masters, 1979). |
|
|
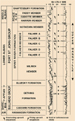
Figure 26. Type log, Elmworth Field, Alberta (after Smith, Zorn, and Sneider, 1984). |
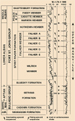
Figure Captions (27, 28, and 29)
|
|
|
|
|
Figure 28. Organic carbon content in Elmworth 6-28-68-13W6M (after Welte et al., 1984). |
|
|


Results of Source-Rock Analysis (after D. Welte et al., 1984)
-
Geochemical studies show that the entire Mesozoic rock section in the Deep-basin is gas-saturated.
-
Gas saturation decreases rapidly in the shallower part of the rock column and updip toward the east.
-
Cretaceous coal measures are important gas source (up to 70 m thick).
-
Source is mainly Type III kerogen – ideal gas generator.
-
Gas is being generated continuously now!
Figure Captions (30, 31, 32, 33, 34, and 35)
|
|
|
|
|
|
|
|
|
|
|
|
|
|
Figure 34. Map of Deep basin, Alberta – British Columbia, showing well control as of March, 2004. |
|
|


Production:
> 5 TCF Gas
> 1 Billion Bbls Condensate + Oil
Reserves:
> 5 TCF Gas
Resource:
10s of TCF Gas
Proved Reserves
-
Proved reserves are volumes that are considered recoverable with a high degree of certainty under anticipated operating and economic conditions.
-
Proved reserves may be assigned to both developed and undeveloped lands.
Probable Reserves
-
Probable reserves are volumes that may be recovered from lands in the vicinity of proven reserves but where there is some degree of geological, engineering, operational, or economic risk.
Resources
-
Hydrocarbons in a producing trend that require improved technology and/or significant price increase to be recovered.
Key Managers and Staff, Initial Exploration and Development (Figure 36)
|
|
Figure 36. Key members of the staff, standing by evidence of their success at Elmworth. |

Sneider & Meckel Associates, Inc. Canadian Hunter Exploration, Ltd.
J. Farina J. Boyd E. Hawkes
L. Fons J. Christensen R. Hietala
L. Meckel T. Connally J. Masters
R. Sneider T. Davis D. Smith
J. Gray T. Taylor
P. Hill R. Wyman
Drilling / Completion - Reservoir Engineering - Land Strategy
Lessons learned so as to avoid the common reasons for failure are to:
- Integrate geoscience and engineering data
- Use correct petrophysical models
- Factor the effect of conductive minerals (clays, pyrite)
- Use correct Archie “m” and “n”
- Understand connate water saturation (Sw) vs irreducible water saturation (Swirr) plus Sw
- Recognize damaged zones vs low permeability zones
- Recognize pressure seals’ role in trapping
- Recognize lower limits of pay using f and Sw cutoffs, considering stimulation procedures
- Recognize opportunities, technical improvements, and economic trends from similar basins and geology that can apply to the play / prospect
- Develop sales outlet (e.g., pipelines)
References (Figure 37)
|
|

Davis, T.B., 1984, Subsurface Pressure Profiles in Gas-Saturated basins, in J.A. Masters, ed., Elmworth: Case study of a Deep basin gas field: AAPG Memoir 38, p. 189-203.
Eisbacher, G.H., M.A. Carrigy, and R.B. Campbell, 1974, Paleodrainage pattern and late-orogenic basins of the Canadian Cordillera, in Dickinson, W.R., ed., Tectonics and sedimentation: Soc. Econ. Paleontologists and Mineralogists Special Pub. No. 22, p. 143-166.
Gies, Robert M., 1984, Case history for a major Alberta Deep basin gas trap: The Cadomin Formation, in J.A. Masters, ed., Elmworth: Case study of a Deep basin gas field: AAPG Memoir 38, p. 115-140.
Gray, J. K., 1977, Future gas reserve potential Western Canadian sedimentary basin: 3d Natl. Tech. Conf. Canadian Gas Association.
Jackson, Paul C., 1984, Paleogeography of the Lower Cretaceous Mannville Group of Western Canada, in J.A. Masters, ed., Elmworth: Case study of a Deep basin gas field: AAPG Memoir 38, p. 49-77.
Masters, J.A., 1979, Deep basin gas trap, Western Canada: AAPG Bulletin, v. 63, p. 152-181.
Masters, J.A., 1984, Lower Cretaceous oil and gas in Western Canada, in J.A. Masters, ed., Elmworth: Case study of a Deep basin gas field: AAPG Memoir 38, p. 1-33.
Masters, J.A. ed., 1984, Elmworth: Case study of a Deep basin gas field: AAPG Memoir 38, 316p.
Smith, David G,. Carl E. Zorn, and Robert M. Sneider, 1984, The Paleogeography of the Lower Cretaceous of western Alberta and northeastern British Columbia in and adjacent to the Deep basin of the Elmworth area, in J.A. Masters, ed., Elmworth: Case study of a Deep basin gas field: AAPG Memoir 38, p. 79-114.
Weimer, R.J., 1984, Relation of unconformities, tectonics, and sea-level changes, Cretaceous of Western Interior, U.S.A., in Interregional unconformities and hydrocarbon accumulation: AAPG Memoir 36, p. 7-35.
Welte, D.H., R.G. Schaefer, W. Stoessinger, and M. Radke, 1984, Gas generation and migration in the Deep basin of Western Canada, in J.A. Masters, ed., Elmworth: Case study of a Deep basin gas field: AAPG Memoir 38, p. 35-47.