Print this page
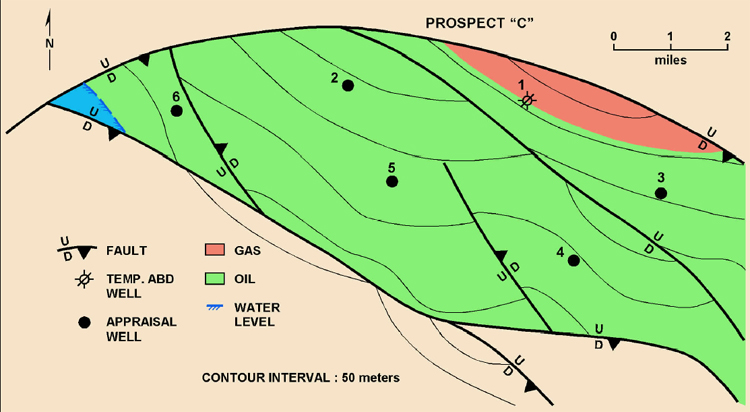
Figure 7. Structure map on “M” Sand, Prospect “C”, Offshore West Africa (based on 3D seismic and 6 appraisal wells).
Click to view three stages in the appraisal of Prospect “C”, as depicted on the structure map (Figures 1, 3, and 7).