Click to view posters in PDF
PSPlay Analysis and Digital Portfolio of Major Oil Reservoirs in the Permian Basin: New Mexico*
By
Ronald F. Broadhead1, William D. Raatz2, Shirley P. Dutton3, and Eugene M. Kim3
Search and Discovery Article #10065 (2004)
*In conjunction with: U.S. Department of Energy. Adapted from poster presentation at AAPG Annual Meeting, Dallas, Texas, April 18-21, 2004.
1New Mexico Bureau of Geology and Mineral Resources, a division of New Mexico Tech, Socorro, NM 87801 ([email protected])
2New Mexico Bureau of Geology and Mineral Resources; present address: OxyPermian, Houston, TX
3Bureau of Economic Geology, University of Texas at Austin, Austin, TX 78713
Abstract
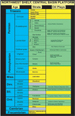
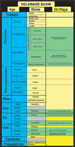
Approximately 300 reservoirs in the New Mexico part of the Permian Basin have cumulative production of more than 1 MMBO, with a combined production of 4.5 billion bbls oil as of 2000. Reservoirs with 1 MMBO cumulative production have been grouped into 17 plays based on geologic parameters, including reservoir stratigraphy, lithology, depositional environment, tectonic setting, and trapping mechanism. The 10 Permian plays have a cumulative production of 3501 MMBO. The two Pennsylvanian plays have a cumulative production of 424 MMBO. Three Siluro-Devonian plays have a cumulative production of 440 MMBO. The two Ordovician plays have a cumulative production of 86 MMBO. Four New Mexico plays are selected for detailed discussion based on favorable production trends, potential for significant bypassed pay, possibilities for enhanced production, or rethinking of exploration concepts that may result in rethinking of exploration, development, and production strategies.
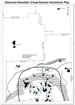
The Delaware Mountain Group Basinal Sandstone Play has 155 reservoirs in New Mexico, 33 with more than 1 MMBO cumulative production. These 33 reservoirs have produced a cumulative total of 112 MMBO. Production from the New Mexico part of this play peaked in the mid-1990's at more than 7 MMBO per year. Reservoirs are deep-water submarine fan sandstones. Primary production via solution gas drive declines quickly as reservoir pressure is depleted. Pressure maintenance, and water flooding in selected cases, may prevent premature abandonment and increase ultimate recovery by more than 50 percent.
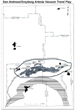
The Upper San Andres and Grayburg Platform Artesia Vacuum Trend Play contains 13 reservoirs with more than 1 MMBO production. These 13 reservoirs have produced a cumulative total of 796 MMBO. Although much of this production has historically been from vugular porosity in carbonates of the upper San Andres Formation, significant reserves remain that may be produced by horizontal drilling to tap underproduced reservoir compartments in established San Andres reservoirs as well as targeting bypassed, behind-pipe pay within the less permeable sandstone of the Grayburg Formation.
The Leonard Restricted Platform Carbonate Play has 34 reservoirs with production exceeding 1 MMBO. Cumulative production from these reservoirs is 431 MMBO. Reservoirs consist of limestones and dolostones deposited on a restricted carbonate platform; associated platform sandstones are also productive. Traps are formed by wide, low-relief anticlines. Uneven pay distribution across structures and strata-limited fracture systems have compartmentailzed reservoirs and resulted in bypassed pay that may be tapped through horizontal drilling.
The Northwest Shelf Upper Pennsylvanian Carbonate Play has been productive from 197 reservoirs, 34 of which have produced more than 1 MMBO. These 34 reservoirs have produced a combined 354 MMBO. Reservoirs consist of algal mounds and associated carbonate sands. Trapping mechanisms are largely stratigraphic. Historically, the largest reservoirs in this play yielded significant production (>10 MMBO cumulative) only decades after initial discovery. Initial development was often predicated on the presumption of structural entrapment of oil. Redevelopment proved entrapment is stratigraphic, resulting in an increase in the productive area and production rates, turning seemingly minor reservoirs into major ones. Rediscovery of the Dagger Draw reservoir in the 1990's increased production by more than one-hundredfold and resulted in an annual production rate of more than 10 MMBO during 1996.
|
uDelaware Mountain Sandstone Play uUpper San Andres/Grayburg play
uDelaware Mountain Sandstone Play uUpper San Andres/Grayburg play
uDelaware Mountain Sandstone Play uUpper San Andres/Grayburg play
uDelaware Mountain Sandstone Play uUpper San Andres/Grayburg play
uDelaware Mountain Sandstone Play uUpper San Andres/Grayburg play
uDelaware Mountain Sandstone Play uUpper San Andres/Grayburg play
uDelaware Mountain Sandstone Play uUpper San Andres/Grayburg play
uDelaware Mountain Sandstone Play uUpper San Andres/Grayburg play
uDelaware Mountain Sandstone Play uUpper San Andres/Grayburg play
uDelaware Mountain Sandstone Play uUpper San Andres/Grayburg play
uDelaware Mountain Sandstone Play uUpper San Andres/Grayburg play
|
Figures Captions (1.1-1.7)
About the ProjectThis article summarizes the New Mexico part of our work developing a play portfolio of major oil-productive reservoirs in the Permian Basin. Data from reservoirs with more than 1 MMBO cumulative production in the Permian Basin were mapped and compiled in a Geographic Information System (GIS). In addition to the 299 reservoirs identified in New Mexico, approximately 1000 reservoirs with more than 1 MMBO cumulative production have been identified in the Texas part of the Permian Basin. Thirty-three plays are defined by this project, 17 of which are partially or wholly in New Mexico. The New Mexico Bureau of Geology and Mineral Resources at New Mexico Tech and the Bureau of Economic Geology at the University of Texas at Austin have jointly undertaken this Preferred Upstream Management Practices (PUMP) initiative funded by the U.S. Department of Energy under contract DE-FC26-02NT15131. The objectives of this PUMP project are to: 1) develop an up-to-date portfolio of oil plays in the Permian Basin of west Texas and southeast New Mexico; 2) study key reservoirs of some of the largest or most active plays to incorporate information on improved practices in reservoir management or development; and 3) widely disseminate the play portfolio via CD-ROM, the internet, and other media.
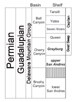
Guadalupian (Upper Permian) Plays(Figures 1.1, 1.2, 1.3, 1.4, and 1.5)
Wolfcampian and Leonardian (Lower Permian) Plays(Figures 1.1, 1.2, 1.3, and 1.6)
Pennsylvanian Plays(Figures 1.1, 1.2, 1.3, and 1.7)
Ordovician, Silurian and Devonian Plays
Emphasized PlaysFour New Mexico plays have been selected for in-depth discussion and analysis in this article:
These plays were selected based on favorable production trends, potential for significant future growth through either new or improved primary or secondary production, or newly applied geologic and/or engineering concepts that may result in rethinking of exploration, development, and production strategies.
Delaware Mountain Group Basinal Sandstone Play
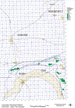
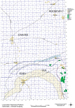
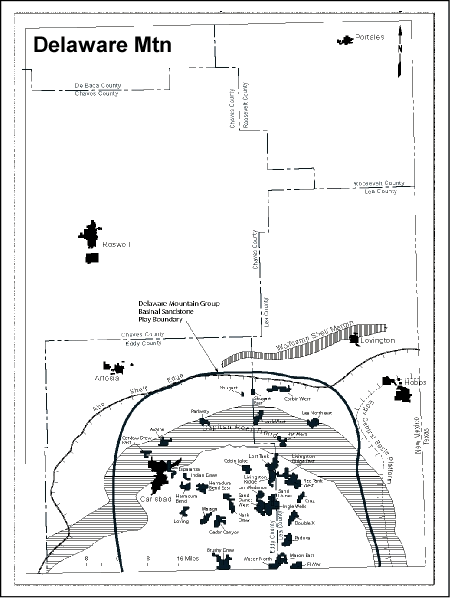
Reservoirs in the Delaware Mountain Group Basinal Sandstone Play lie within the Delaware Basin and stretch from the northern part of the basin in Eddy and Lea Counties south into Texas (Figure 2.1). Production is from submarine fan sandstones in the Bell Canyon, Cherry Canyon, and Brushy Canyon Formations (Figure 2.2). Traps are mostly stratigraphic and formed by submarine fan sandstones deposited in channels and on fan lobes (Figure 2.3). There are 155 known, discovered Delaware Mountain reservoirs in New Mexico, 33 of which have produced > 1 MMBO. Cumulative production from these 33 reservoirs was 112 MMBO as of 2000. Production is obtained from all 3 formations in the Delaware Mountain Group - Bell Canyon, Cherry Canyon and Brushy Canyon (Figure 2.2). Most Bell Canyon reservoirs were found before 1970. Most Cherry Canyon reservoirs were found after 1970. Most Brushy Canyon reservoirs were found in the 1980's and 1990's.
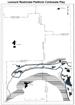
Production from this play has been declining over the past decade as primary production declines within existing reservoirs (Figure 2.4). Currently, most production is obtained from Brushy Canyon reservoirs discovered in the mid-1980's to early 1990's with many earlier found Bell Canyon reservoirs nearing depletion. The increase in production during the late 1980's and early 1990's was a result of discovery of numerous Brushy Canyon reservoirs. Figure 2.5 shows the decline in oil production from the average well in the Livingston Ridge Brushy Canyon reservoir from more than 3000 bbls/month after completion to less than 500 bbls/month 5 years (60 months) after well completion. Steep production declines result from early pressure depletion in these solution gas drive reservoirs. If the minimum economic production rate is considered to be 3 BOPD, then a typical Livingston Ridge reservoir may recover 91 MBO over a productive life of 108 months.
Injection of water for pressure maintenance by Phillips Petroleum at the Cabin Lake reservoir resulted in increased oil production from existing wells (Figure 2.6). Pressure maintenance in these solution gas drive pools should take place before a secondary gas cap is formed and may prevent premature well abandonment that can result from low production rates that accompany pressure and gas depletion. Pressure maintenance has similar effect at the Nash Draw reservoir (M. Murphy, personal communication, 2003). Although the less permeable and more heterogeneous Delaware reservoirs may not be suitable for waterflooding, this EOR technique can have startling success in proximal Cherry Canyon and Brushy Canyon reservoirs. In the Indian Draw Cherry Canyon reservoir, discovered in 1973, an estimated 1.9 MMBO could be recovered by primary production and an additional 1.6 MMBO, or 81% of primary production, will be recovered as a result of waterflood operations (Figure 2.7). Waterflooding this reservoir will therefore prevent premature well and reservoir abandonment and will result in recovery of significant oil resources.
Upper San Andres and Grayburg Platform - Artesia Vacuum Trend PlayFigure Captions (3.1-3.7)
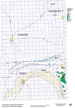
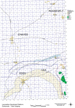
Play GeologyThe Upper San Andres and Grayburg Platform - Artesia Vacuum Trend Play extends between the cities of Artesia and Hobbs in Eddy and Lea counties along the Artesia-Vacuum arch. The play has 13 reservoirs with > 1 MMBO cumulative production (Figure 3.1). Cumulative production from these 13 reservoirs was 796 MMBO as of 2000. Production is obtained from both the San Andres Formation and the overlying Grayburg Formation; their stratigraphic positions are illustrated in Figure 3.2. The upper San Andres Formation was deposited on a restricted carbonate shelf and is a backreef deposit composed of dolowackestones, dolopacktones, and dolograinstones. It is composed of high-frequency, upward-shoaling carbonate depositional cycles capped by low-permeability peritidal facies that vertically compartmentalize the reservoir (e.g., Purves, 1986; Modica and Dorobek, 1996; Handford et al., 1996; Stoudt and Raines, 2001; Pranter et al., 2004). Reservoir facies lie between the Guadalupian shelf margin to the south and tight evaporites and dolostones of the inner shelf to the north. In some reservoirs, there is significant permeability and porosity enhancement associated with unconformities and subaerial exposure diagenesis (karsting; Hovorka et al., 1993). In other reservoirs such as Vacuum, karstification has acted to further compartmentalize reservoirs horizontally as well as vertically through development of karst pore systems and subsequent filling of karst pore systems with impermeable sandstones, collapsed carbonates and evaporites (Stoudt and Raines, 2001; Pranter et al., 2004). High-angle, low-displacement (<25 ft) faults have also acted to horizontally compartmentalize reservoirs (Pranter et al., 2004). This vertical and horizontal compartmentalization makes development of reservoirs incomplete with vertical wells drilled on standard 40-acre spacing. The Vacuum reservoir has responded favorably to CO2 flooding. Horizontal laterals have demonstrated the ability to produce bypassed, unswept, and banked oil. The Grayburg Formation consists of interbedded sandstones, siltstones, and dolomitic carbonates (Handford et al., 1996; Modica and Dorobek, 1996). The sandstones are the main Grayburg reservoirs and were deposited in coastal sabka, sandflat, and eolian environments. Carbonates are generallly impermeable subtidal deposits. Substantial pay may remain behind pipe in Grayburg sandstones. The Artesia-Vacuum arch is a shallow structure that overlies the deeper Abo shelf edge reef trend and Bone Spring flexure. Reservoir position with respect to the crest of the arch determines whether the San Andres or the Grayburg dominates production in any given field. The fields located in structurally higher positions will have substantial production from the Grayburg as well as the underlying San Andres. Fields occupying a structural position lower on the arch tend to be productive mostly from the Grayburg with the underlying San Andres mostly wet. The regional vertical seals are impermeable facies in the upper Grayburg and Queen Formations.
Annual production from 1970 to 2000 for the 13 reservoirs within the Upper San Andres and Grayburg Platform - Artesia Vacuum Trend Play that have produced more than 1 MMBO is shown in Figure 3.3. The significant increase in production during the mid-1980's was caused by implementation of waterflood/pressure maintenance projects in the Vacuum reservoir.
Figure 3.4, which plots annual oil production and number of injection wells in the Vacuum reservoir, shows the response of reservoirs to pressure maintenance/waterflooding in the 1980's. Small-displacement normal faults, along with depositional cycles, and sediment- and evaporite-filled karst pore systems have compartmentalized the San Andres in the Vacuum reservoir, leaving behind banked and unswept oil. Two laterals drilled by Texaco from an existing vertical well resulted in a substantial increase in production from a single well (Figure 3.5). The upturn in production from the Grayburg Jackson reservoir during the mid-1990's is due in large part to recompletions in previously bypassed pay of the Grayburg Formation (B. Brister, personal communication, 2003; Figure 3.6). Production history of three wells in Burnett Oil Company lease in Grayburg Jackson reservoir indicates a substantial increase in production due to recompletion of San Andres wells to behind-pipe pay in Grayburg sandstones (Figure 3.7).
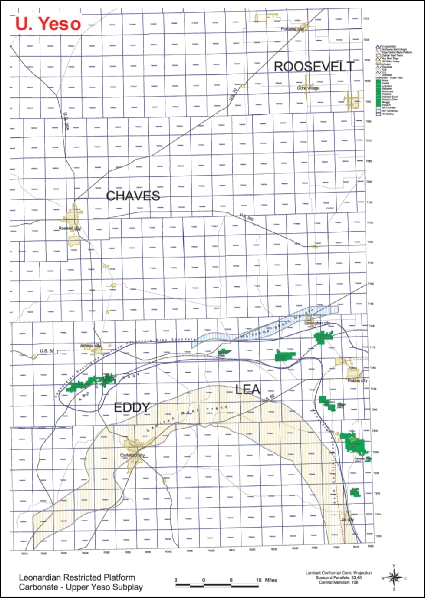
Leonard Restricted Platform Carbonate Play
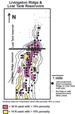
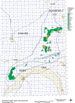
Reservoirs in the Leonard Restricted Platform Carbonate Play lie on the Northwest Shelf of the Permian Basin and on the Central Basin Platform. On the Northwest Shelf, the play extends along a curvilinear trend near the shelf margin and extends east into Texas. On the Central Basin Platform, the play extends along a trend on the western edge of the platform and south into Texas. Reservoirs are mostly dolostones and limestones in the Yeso Formation (Permian: Leonardian), but Yeso sandstones are productive in some reservoirs. Reservoir strata were deposited on a restricted carbonate platform and a variety of depositional facies are present. Traps are generally formed by low-relief anticlines. Facies variations in reservoir strata create porosity pinchouts on anticlinal noses as well as uneveness in reservoir quality across a structure, resulting in compartmentalization of some reservoirs. A single structure may yield productive pay in multiple zones. There are 102 known discovered reservoirs in the New Mexico portion of this play, 34 of which have produced more than 1 MMBO. Cumulative production from these 34 reservoirs was 431 MMBO as of 2000. In New Mexico four subplays (Figure 4.1) are defined by the stratigraphic unit or units from which production is obtained within a reservoir: 1. Upper Yeso subplay (Glorieta Formation & Paddock Member of Yeso Formation) (Figure 4.2) 2. Blinebry subplay (Blinebry Member of Yeso Formation) (Figure 4.3) 3. Tubb subplay (Tubb Member of Yeso Fm.) (Figure 4.4) 4. Drinkard subplay (Drinkard Member of Yeso Formation) (Figure 4.5)
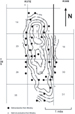
Production from this play has been in decline over the past 30 years as the large reservoirs, mostly discovered before 1965, were depleted (Figure 4.6). The increase in total production from this play during the early 1990's was a result of waterflooding and increased production in the Blinebry, Dollarhide, Vacuum, and Warren reservoirs. Figure 4.7 is a structure contour map of the Blinebry Member at the Justis Blinebry reservoir, showing a typical trap in this play, formed by a low-relief anticline. One structure will typically form traps in multiple pay zones within multiple members of the Leonardian Yeso Formation. The best reservoir strata are not blanket or sheet deposits that cover an entire trap-forming anticline. The block diagram of depositional environments in the Paddock Member at the Vacuum reservoir, in Figure 4.8A, shows that the oolite barrier (which is the most prolifically productive facies) is not everywhere present. This type of facies distribution explains porosity trends in the Oil Center Blinebry reservoir, which are not evenly spread across the trap-forming structure (Figure 4.8B). The Paddock reservoir at Vacuum Glorieta consists of interbedded and interfingering facies, some of which are more densely fractured than others. The Paddock was waterflooded at the Vacuum reservoir. Premature water breakthrough in fractured lower Paddock dolostones, left bypassed recoverable oil remaining in unfractured upper Paddock grainstones (Martin and Hickey, 2002). Texaco drilled 31 horizontal laterals off of existing vertical wells in the unfractured grainstones in an effort to produce unswept oil. Twenty-four laterals were used as production wells, and seven laterals were used as water injection wells. The result was a substantial increase in production (Figure 4.9) with an ultimate increase in recovery projected to be 2.6 MMBO.
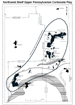
Northwest Shelf Upper Pennsylvanian Carbonate Play
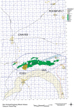
Reservoirs in the Northwest Shelf Upper Pennsylvanian Carbonate Play lie on the Northwest Shelf of the Permian Basin. The play trend extends from the shelf edge near Carlsbad in Eddy County to the shelf interior in Chaves and Roosevelt counties. Reservoirs are limestones and dolostones of Canyon (Upper Pennsylvanian:Missourian) and Cisco (Upper Pennsylvanian: Virgilian) age. Traps are primarily stratigraphic and are formed by phylloid algal mounds and associated grainstones and packstones (Cys, 1986; Speer, 1993; Mazzullo, 1998; Cox et al., 1998). Productive porosity is primarily vugular, intercrystalline, and intergranular. Most reservoirs in this play were initially discovered by drilling structures or by testing shows encountered while drilling to deeper zones. There are almost 400 known discovered reservoirs in this play, 200 of which are currently nonproductive and 35 of which have produced more than 1 MMBO (Figure 5.1). Cumulative production from these 35 reservoirs was 354 MMBO as of 2000. Many of these reservoirs are characterized by high water cuts; produced water volumes often exceed produced oil volumes. Reservoirs in this play are productive primarily from Canyon and Cisco strata of Late Pennsylvanian age and from the Bough zones of earliest Wolfcampian age (Figure 5.2). Depositional model for Upper Pennsylvanian algal mound fairway for Dagger Draw South reservoir is shown in Figure 5.3.
Production from this play reached a peak in the 1990's as a result of redevelopment of the Dagger Draw North and Dagger Draw South reservoirs and has been declining since 1997 as redevelopment wells at Dagger Draw have begun to enter depletion stages of the production cycle (Figure 5.4). The huge decline in the early 1970's resulted from depletion of reservoirs discovered and developed during the 1950's and 1960's.
The Baum reservoir was discovered in 1955, but only minimal production was obtained as wells were drilled on structural closures. This reservoir saw a 1st phase of redevelopment in the late 1960's (Figure 5.5), and production increased as new wells were drilled in previously unrecognized parts of the reservoir and the stratigraphic nature of entrapment became apparent. Production again spiked in the early 1980's as yet another wave of wells was drilled in previously unrecognized parts of the reservoir. Redevelopment brought into production 99% of the oil reserves.
Upper Pennsylvanian carbonate reservoirs in southeast New Mexico have typically been discovered by drilling small seismically defined anticlines. Initial development has generally been concentrated on the crests of the structures, and in most of the larger reservoirs, generally did not extend into offstructure areas. Subsequent drilling generally proceeded in discrete phases, each with a corresponding increase in production and reserves. The stratigraphic nature of entrapment was often not recognized until most of the reservoir was drilled out. Recognition of the stratigraphic nature of entrapment is essential if the reservoir is to be drilled out efficiently and completely in the years immediately following initial reservoir discovery. Of the 400 reservoirs in this play, 84% have less than 10 producing wells, 57% have less than 3 wells, and almost 200 have no productive wells, having never produced or having been abandoned. It is likely that a number of small reservoirs that have been developed only on structures are underdeveloped. Additional study of carbonate facies is needed to fully delineate traps. High water cuts often exceed produced oil volumes in a reservoir. Production under these circumstances may be feasible with the use of modern, downhole, high-volume pumps that can move large volumes of fluid economically, as is the case at Dagger Draw (Brent May, personal communication, 1998). Most wells in the Dagger Draw North and Dagger Draw South reservoirs were drilled in the 1990's as a result of redevelopment (Figure 5.6). Initial reservoir discovery was in 1963. More than 90% of oil reserves have been brought into production as a result of redevelopment.
AcknowledgmentsWe thank Dan Ferguson of DOE for his input, guidance, and support. We also acknowledge our partners at the Bureau of Economic Geology: Cari Breton, Steve Ruppel, Charlie Kerans, Jerry Lucia, and Mark Holtz. Brian Brister of the New Mexico Bureau of Geology and Mineral Resources provided insight into the San Andres/Grayburg Artesia Vacuum Trend reservoirs. Mark Murphy of Strata Production Corporation provided helpful discussion on pressure maintenance in Delaware Mountain Group Basinal Sandstone reservoirs. Zhou Jianhua, a graduate student in computer science at New Mexico Tech, did our GIS work. Irene Roselli, a New Mexico Tech undergraduate student, energetically assembled reservoir production data.
ReferencesBroadhead, R.F., Luo, F., and Speer, S.W., 1998, Oil and gas resources at the Waste Isolation Pilot Plant (WIPP) site, Eddy County, New Mexico: New Mexico Bureau of Mines and Mineral Resources, Circular 206, p. 3-72. Burnham, D.E., 1991, Depositional environments and facies distribution of the Permian Paddock member of the Yeso Formation, Vacuum (Glorieta) field, Lea County, New Mexico: M.S. thesis, The University of Texas of the Permian Basin, 140 p. Cox, D.M., Brinton, L., and Tinker, S.W., 1998, Depositional facies and porosity development of an Upper Pennsylvanian algal mound reservoir, South Dagger Draw, Eddy County, New Mexico, in Winfree, K., ed., Cored reservoir examples from Upper Pennsylvanian and Lower Permian carbonate margins, slopes and basinal sandstones: West Texas Geological Society, Publication 98-103. Cys., J.M., 1986, Lower Permian grainstone reservoirs, southern Tatum Basin, southeastern New Mexico, in Ahlen, J.L., and Hanson, M.E., eds., Southwest Section of AAPG Transactions and guidebook of 1986 convention, Ruidoso, New Mexico: New Mexico Bureau of Mines and Mineral Resources, p. 115-120. Handford, C.R., Candelaria, M.P., and Lafollette, S., 1996, Accommodation cycles in peritidal carbonate and continental to shoreface siliciclastic facies, San Andres - Grayburg Formations, Eddy County, New Mexico, in Martin, R.L., ed., Permian Basin oil and gas fields: keys to success that unlock future reserves: West Texas Geological Society, Publication 96-101, p. 65-80. Hovorka, S.D., Nance, H.S., and Kerans, C., 1993, Parasequence geometry as a control on permeability evolution: examples from the San Andres and Grayburg Formations in the Guadalupe Mountains, New Mexico, in Loucks, R.G., and Sarg, J.F., Carbonate sequence stratigraphy: AAPG Memoir 57, p. 493-514. Kincheloe, D., and David, E.K., 1977, Oil Center Blinebry, in A symposium of the oil and gas fields of southeastern New Mexico, 1977 supplement: Roswell Geological Society, p. 142-143. Marshall, L.R., and Foltz, G.A., 1960, Justis Blinebry, in A symposium of the oil and gas fields of southeastern New Mexico, 1960 supplement: Roswell Geological Sociey, p. 114-115. Martin, R.L., and Hickey, K.F., 2002, Horizontal drilling at Vacuum Glorieta West unit, Lea County, New Mexico: a case history, in Hunt, T.J., and Lufholm, P.H., eds., The Permian Basin: preserving our past - securing our future: West Texas Geological Society, Publication 02-111, p. 117-124. May, B.A., 1996, Geology and development history of the Livingston Ridge and Lost Tank Delaware pools, southeastern New Mexico, in DeMis, W.D., and Cole, A.G., eds., The Brushy Canyon play in outcrop and subsurface: concepts and examples: Permian Basin Section SEPM, Publication 96-38, p. 113-118. Mazzullo, S.J., 1998, Depositional model and exploration strategies for the Cisco-Canyon (Upper Pennsylvanian) on the Northwest shelf, southeastern New Mexico, in DeMis, W.D., and Nelis, M.K., eds., The search continues into the 21st century: West Texas Geological Society, Publication 98-105, p. 31-40. Modica, C.J., and Dorobek, S.L., 1996, High frequency sequence framework and effects of exposure events on porosity evolution and reservoir heterogeneity: Maljamar field, Lea County, southeast New Mexico, in Martin, R.L., ed., Permian Basin oil and gas fields: keys to success that unlock future reserves: West Texas Geological Society, Publication 96-101, p. 25-30. Pranter, M.J., Hurley, N.F., Davis, T.L., Raines, M.A., and Wehner, S.C., 2004, Dual-lateral horizontal wells successfully target bypassed pay in the San Andres Formation, Vacuum field, New Mexico: AAPG Bulletin, v. 88, p. 99-113. Purves, W.J., 1986, Depositional and diagenetic controls on porosity, upper San Andres Formation - Bridges State leases, Vacuum field, Lea County, New Mexico, in Bebout, D.G., and Harris, P.M., eds., Hydrocarbon reservoir studies, San Andres/Grayburg Formations, Permian Basin: Permian Basin Section SEPM, Publication 86-26, p. 49-53. Reddy, G., 1995, Dagger Draw South, in A symposium of oil and gas fields of southeastern New Mexico, 1995 supplement: Roswell Geological Society, p. 210-215. Sheldon, V.P., 1956, Grayburg-Jackson field map: Structural contours on top of red sand, in A symposium of oil and gas fields of southeastern New Mexico: Roswell Geological Society, p. 188. Speer, S.W., 1993, Upper Pennsylvanian, in Atlas of major Rocky Mountain gas reservoirs: New Mexico Bureau of Mines and Mineral Resources, p. 154-156. Stoudt, E.L., and Raines, M.A., 2001, Reservoir compartmentalization in the San Andres Formation of Vacuum field, Lea County, New Mexico - peritidal deposits and karst overprints create vertical and lateral barriers to fluid flow on carbonate platform dolopackstones and dolograinstones (abstract): AAPG Bulletin, v. 85, p. 390. |


