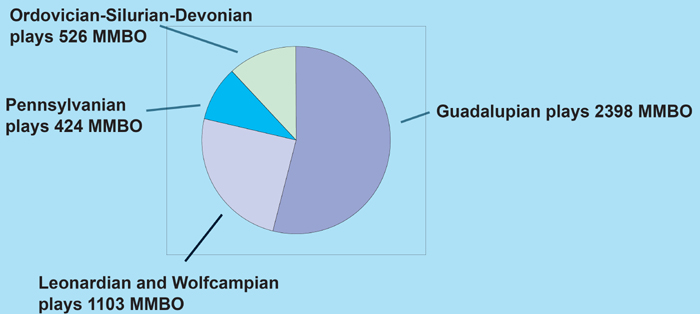
Figure 1.3. Diagram illustrating the relative cumulative production from the various oil plays in the New Mexico part of the Permian Basin.
Figure 1.3. Diagram illustrating the relative cumulative production from the various oil plays in the New Mexico part of the Permian Basin.