Click on desired image for enlargement.
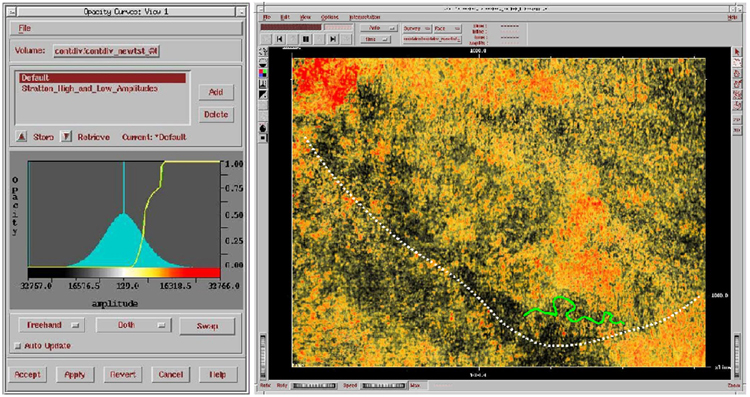
Figure 5: Map view of the trim volume in Figure 3C with the opacity curve to the left applied. The prospective anomaly can be seen the lower right-center. Often low amplitude patterns are more clear where opacity has removed the data. The white dashed line follows a low amplitude trend related to the toe of a prograding complex. Some low amplitude meanders may be seen as well (one is high-lighted in green).