Click on desired image for enlargement.
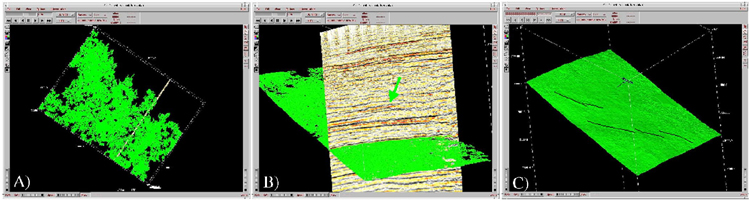
Figure 3: Autopick of continuous horizon. Frame A shows the first iteration of the autopick. Frame B shows the second iteration, with a 3-D Slice showing the relation of the horizon to the anomaly (marked by the arrow). The horizon is several hundred ms below the anomaly, but the reflections are relatively conformable. Frame C shows the final horizon after three iterations of the autopicker and an interpolation. Subtle, low offset fault patterns can be interpreted.