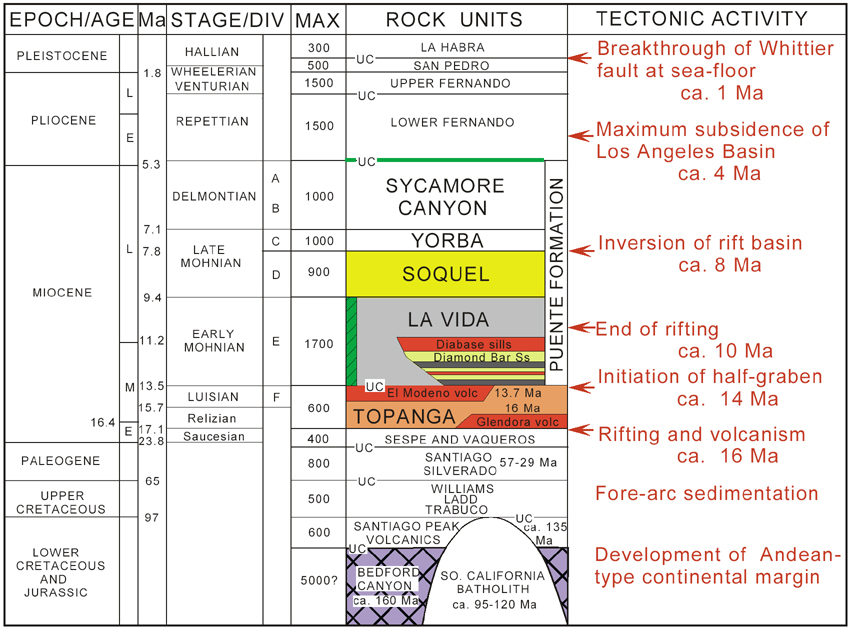
Figure 3. Stratigraphic column. Green bar shows oil source rock interval. MAX (m) indicates approximate maximum thickness of a unit in meters in the study area. Cenozoic ages from Turner (1970), Blake (1991), Berggren et al. (1995), McCulloh et al. (2000), Barron and Isaacs (2001). Mesozoic ages from Larson, et al. (1958), Imlay (1964), Banks and Silver (1966) Fife et al. (1967). Divisions A through F are benthic foraminiferal divisions from Wissler (1943) with ages of division boundaries from Blake (1991) and Barron and Isaacs (2001). Time of maximum subsidence of Los Angeles basin from Ingersoll and Rumelhart (1999, Fig. 3).