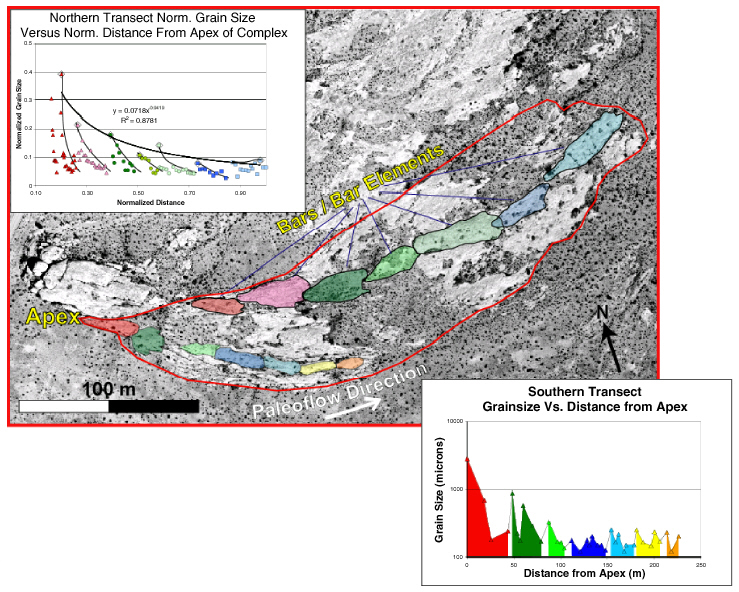
Figure 5. Salt Wash grain size from visual estimates of outcrop surface. Northern transect is plotted as normalized grain size (grain size/max. grain size) versus normalized distance from apex (downstream terminus = 1). Southern transect is shown with log scale for grain size (microns) and distance from apex (m).