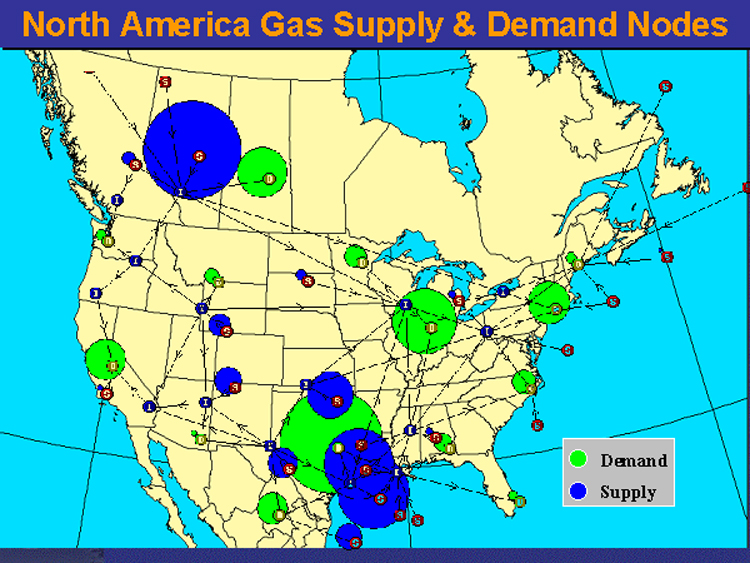
Figure 5. Current North America gas market. Regional supply and demand volumes indicated by diameter of the bubbles. Transportation network is diagrammatic.
Figure 5. Current North America gas market. Regional supply and demand volumes indicated by diameter of the bubbles. Transportation network is diagrammatic.