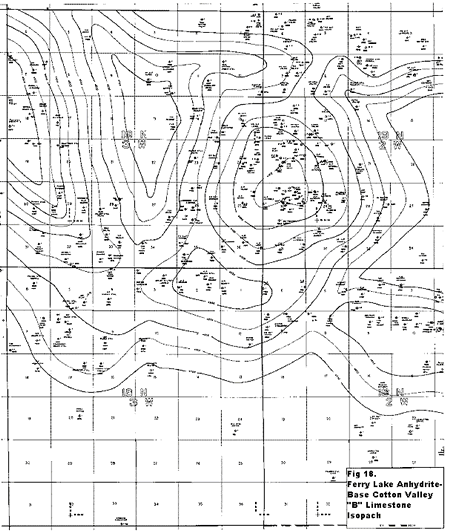
Fig. 18. Isopach map from the base of the Ferry Lake Anhydrite to the base of the Cotton Valley "B" limestone. Contour interval, 50 ft.
Fig. 20. Structure map (1989) on top of the McFearin/Davis "H" sandstone with McFearin/Davis producing wells circled. Contour interval, 100 ft.
Fig. 21. Structure map (1989) on top of the Cotton Valley Vaughn sandstone. Vaughn sandstone producing wells are circled. Because there are two separate Vaughn sandstones, two water levels are shown. See text for explanation. Contour interval, 50 ft.
Fig. 22. Structure map of the Cotton Valley Bodcaw sandstone with Bodcaw producing wells circled. The original and current gas-water contacts are shown. Contour interval, 50 ft.
Fig. 23. Structure map (1989) on the base of the Cotton Valley "B" limestone showing "C" sandstone producing wells (triangles) and "D" sandstone producing wells (circles). Updip pinch-outs of the upper, middle, and lower "D" sandstones are also shown. Contour interval, 100 ft.
Fig. 25. Structure map (1989) on top of the lower Hosston with lower Hosston producing wells circled. Contour interval, 50 ft.
Fig. 26. Structure map (1989) on top of the middle Hosston with middle Hosston producing wells circled. Contour interval, 25 ft.
Fig. 27. Structure map (1989) on top of the upper Hosston with upper Hosston producing wells circled. Contour interval, 50 ft.
Fig. 28. Structure map (1989) on top of the James sandstone showing James producing wells (circles) and James gas-storage wells (triangles). Contour interval, 10 ft.