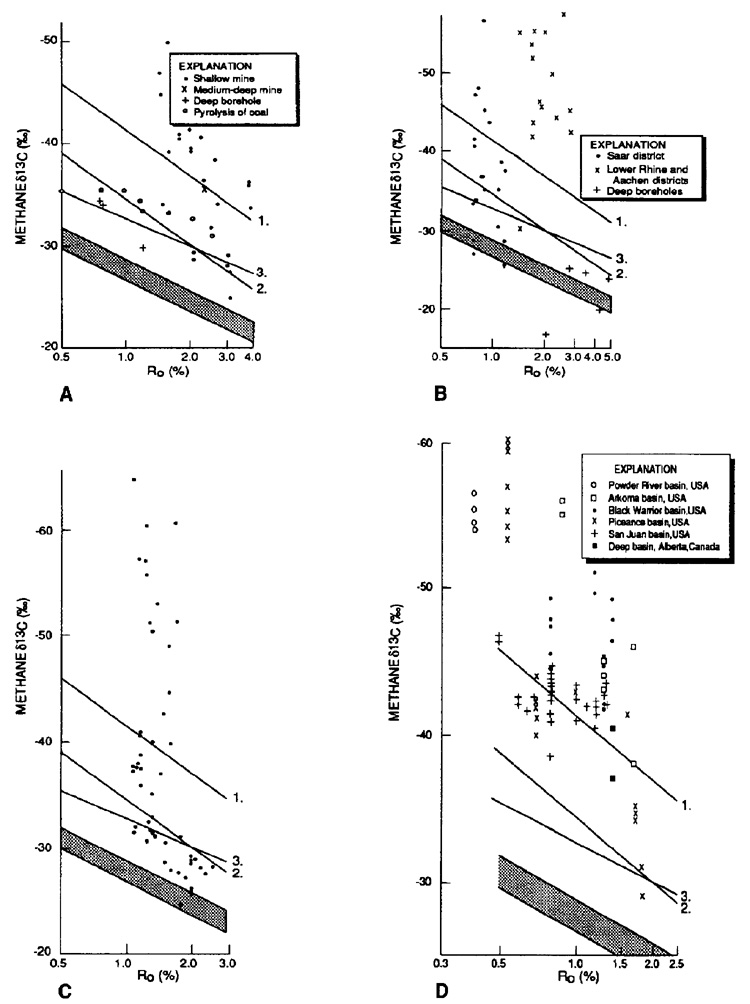
Figure 11. Methane d13C versus vitrinite reflectance (R0) for coalbed gases and coals, respectively. (A) Eastern China. Data from Dai et al. (1987). (B) Western Germany. Data from Colombo et al. (1970). (C) Lower Silesian basin, Poland. Data from Kotarba (1988, 1990). (D) Canada and United States. Sources of data are listed in Table 1. Regression line 1 is for gases generated from types II/III kerogen (Faber, 1987); line 2 is for coalbed and coal pyrolysis gases in China (Dai et al., 1987); line 3 is for coal-derived gases in China (Shen et al., 1988); and stippled area is for coal-derived and coal pyrolysis gases from several authors as summarized by Whiticar (1992).