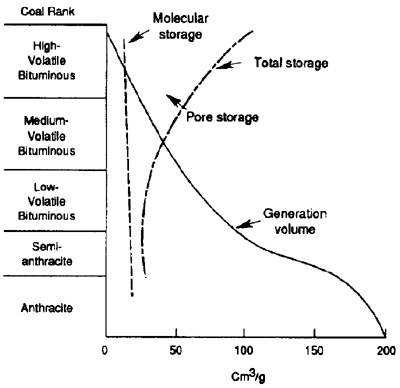
Figure 5. Plot showing volumes of methane generated and stored per gram of coal with increasing rank. Modified from Meissner (1984) and P.D. Jenden (personal communication, 1992).
Figure 5. Plot showing volumes of methane generated and stored per gram of coal with increasing rank. Modified from Meissner (1984) and P.D. Jenden (personal communication, 1992).