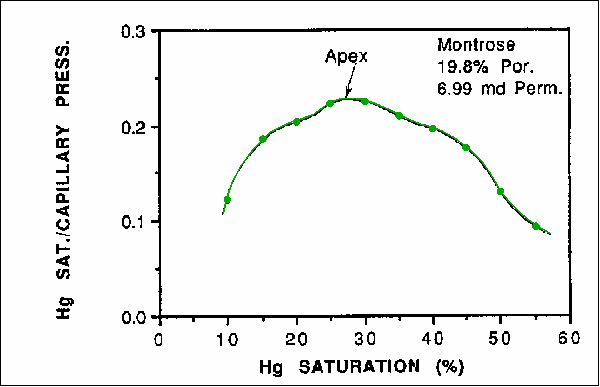
Figure 4. A plot of Hg saturation/capillary pressure versus Hg saturation, as a means of determining the apex of Thomeer's (1960) hyperbola. This is a more accurate method than the one depicted on Figure 2.
Figure 4. A plot of Hg saturation/capillary pressure versus Hg saturation, as a means of determining the apex of Thomeer's (1960) hyperbola. This is a more accurate method than the one depicted on Figure 2.