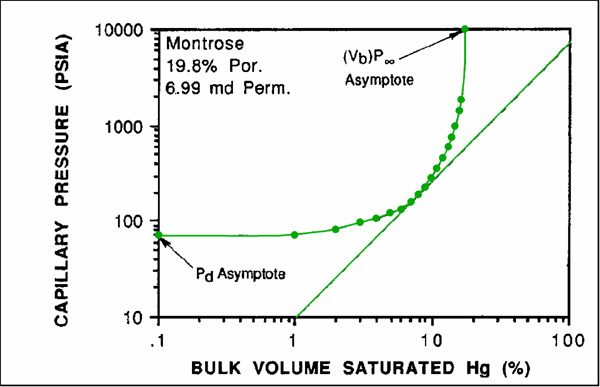
Figure 2. A log-log hyperbolic plot of mercury injection data following Thomeer (1960) and Swanson (1981). Thomeer used the values of the asymptotes in his mathematical description. The 45o-line is tangent to the hyperbola at the apex. Some mercury curves have no apex.