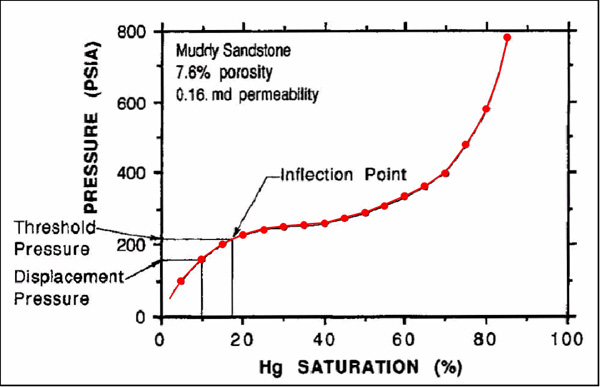
Figure 1. Presentation of mercury injection-capillary pressure data. Often this is presented as a semilog plot. The threshold pressure, as defined graphically by Katz and Thompson (1987), corresponds to the inflection point at which the curve becomes convex upward. The displacement pressure (Pd) was defined by Schowalter (1979) as the pressure at a mercury saturation of 10%.