|
FIGURE CAPTIONS
(1-11)
 Figure 1 - Symmetrical Descriptive
Classification of Basic SP Log Shapes Figure 1 - Symmetrical Descriptive
Classification of Basic SP Log Shapes
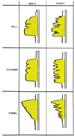 Figure 2 - Simplified Descriptive
Classification of Basic SP Log Shapes Figure 2 - Simplified Descriptive
Classification of Basic SP Log Shapes
 Figure 3 - Three-Dimensional
Representation of Basic SP Log Shapes Figure 3 - Three-Dimensional
Representation of Basic SP Log Shapes
 Figure 4 - Sand Zones (or Sand Bodies)
as Represented on the Electric Log Figure 4 - Sand Zones (or Sand Bodies)
as Represented on the Electric Log
 Figure 5 - Types and Categories of Sand
Bodies Figure 5 - Types and Categories of Sand
Bodies
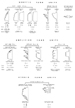 Figure 6 - Index of Basic SP Log Shapes Figure 6 - Index of Basic SP Log Shapes
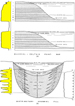 Figure 8 - Genetic Sand Units; Idealized
Examples of Alluvial-Deltaic Point Bar, Distributary Channel Fill Figure 8 - Genetic Sand Units; Idealized
Examples of Alluvial-Deltaic Point Bar, Distributary Channel Fill
 Figure 9 - Amplified Sand Units;
Idealized Examples of Alluvial Point Bar Buildup, Delta-Marine Fringe
Buildup Figure 9 - Amplified Sand Units;
Idealized Examples of Alluvial Point Bar Buildup, Delta-Marine Fringe
Buildup
 Figure 10 - Amplified Sand Units;
Idealized Examples of Barrier Bar Buildup, Turbidity Current Buildup of
Graded Beds Figure 10 - Amplified Sand Units;
Idealized Examples of Barrier Bar Buildup, Turbidity Current Buildup of
Graded Beds
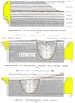 Figure 11 - Hybrid Sand Units; Idealized
Examples of Progradation of Alluvial over Delta-Marine Fringe,
Progradation of Distributary through Delta-Marine Fringe, Marine
Transgression over Delta Figure 11 - Hybrid Sand Units; Idealized
Examples of Progradation of Alluvial over Delta-Marine Fringe,
Progradation of Distributary through Delta-Marine Fringe, Marine
Transgression over Delta
INTRODUCTION
Purpose of Report
Data collected in the past few years by
operating and research workers indicate that the characteristics of the
self-potential (SP) log 01--ve important clues to the origin of
subsurface sands. From the log character and its genetic implication,
information can be gathered about (1) external features,
including the trend, distribution, thickness, and shape of the sand
body; and (2) internal characteristics, including grain
size, sorting, interbedding, and sand continuity.
The ability to determine the properties
of a sand body in the subsurface is a function of the kind and amount of
sample material available and the limitations of interpretations based
on geophysical logs. In some regions sample material is so rare or of
such a nature that the knowledge of sand bodies must be derived largely
from the electric log. For these reasons, and especially because the
electric log is the common tool of the subsurface geologist, the subject
of this report deserves considerable emphasis and research effort.
The report is designed to gather
together the various types of data bearing on the problem, and to report
the progress and status of the concepts.
Basic Principles
External Features
The use of SP electric log
characteristics to estimate the subsurface trend and distribution of
sand bodies is based on the premise that a sand body deposited under a
particular set of depositional and tectonic conditions has (1) a
characteristic vertical sequence of sediment properties, (2) a
distinctive external form, and (3) a preferred orientation or
distribution relative to the depositional framework of the basin. For
example, if one can deduce from an electric log that the sand body
penetrated is a river deposit, and if he knows from his regional studies
that the depositional slope is in a certain direction, he can estimate
the configuration of the sand body and infer that the trend is parallel
to the depositional slope.
Internal Characteristics
The use of the SP log to estimate the
internal characteristics of sands, especially permeability and porosity,
is based on the premise that a sand body deposited under a particular
set of depositional conditions has (1) a characteristic range of grain
sizes and degrees of sorting, (2) a characteristic lithological
variability or "lenticularity," and (3) a characteristic permeability
and transmiscibility to fluid flow. For example, alluvial sands tend to
be considerably coarser grained than deltaic sands, and alluvial sand
bodies are less homogeneous and have more interruptions of sand
continuity than barrier bars.
Deductions concerning permeability and
transmiscibility based on the knowledge of primary rock properties are
subject to error if the sands contain important amounts of secondary
cement or if the sands are severely compacted.
Return
to top.
Historical Notes
Following World War II, interest was
renewed in methods for predicting the subsurface trends of potential
reservoir sands. Subsurface studies in the Areas were resumed on a large
scale, and investigations of sand bodies both in the Recent and
subsurface were begun in the newly created E and P Research Laboratory.
It was recognized that the electric log character of various sands was
different, but generally applicable concepts for interpretation were
lacking.
At the EPR Laboratory, early studies of
grain-size variations in reservoir sands, together with early studios of
Recent sediments, indicated that the sand deposits of meandering rivers
should grade from coarse to fine upwards. It was noted that the
grain-size changes correlated with changes in the self-potential curve
of the electric log. Attention was then directed to barrier bar deposits
in the Recent where a slight increase in grain size upward was noted.
The contrast between these two types of sand bodies in this respect was
striking. Although no grain-size measurements in a subsurface sand body
of known barrier bar origin were then available, sand bodies of supposed
shoreline origin which displayed the predicted self-potential
characteristics could be found.
At the same time that these ideas were
developing, many examples of characteristic self-potential variations
were also being found by Shell geologists in operations. The concept of
"alluvial" and "barrier bar" SP types became established (LeBlanc, 1950;
Nanz, 1950; Nanz and Wilson, 1955; Nanz, 1956). Within the past few
years knowledge in this field has expanded at a great rate. Detailed
subsurface studies have shown that characteristic self-potential
variations are also to be expected for distributary channel deposits and
for delta-marine fringe sands (Bowling, 1958; D’Olier, 1959; Harris,
1958; LeBlanc et al., 1959; Shelton and Parrott, 1958; Wilson and
Parrott, 1958).
The subsurface studies have been
successful largely because of parallel studies of similar types of
Recent sediments (Bernard, 1955; Bernard and Major, 1956a, 1956b;
Bernard, Major, and Parrott, 1958a, 1958b; Bernard and Parrott, 1958;
Bernard, Major, Parrott, and Anderson, 1958; Major and Bernard, 1956).
Recently, Widco electric logs have been run in shallow borings through
sand deposits of various environments, and the data obtained have
provided a firm basis for the concepts (Bernard, Major, and Parrott,
1958b; Bernard, Major, Parrott, and Anderson, 1958).
Self-Potential Log as a Measure of
Lithologic Variations
The self-potential log for a permeable
sand associated with shales is primarily a function of two electrical
phenomena (Archie, 1953). The most significant of the two is the
electrochemical potential caused by the combination of liquid-junction
potential and membrane potential of the system
drilling mud | shale |
permeable sand containing brine | | drilling mud
The other primary effect is the
electrokinetic or flow potential due to the passage of mud filtrate into
the permeable formation. The flow potential is a minor effect in
comparing the self potential of two portions of a sand formation because
it is controlled mostly by the mud cake.
The first detailed comparison by the EPR
Laboratory of self-potential and textural properties of a reservoir sand
was the study of zone 19b in the Seeligson field (Nanz, 1950). The
conclusion reached was that the self-potential correlated directly with
the content of interstitial silt and clay.
If one assumes that (1) the salinity of
the formation water is constant and different from that of the mud, (2)
the mud column is uniform, (3) the hydrocarbon saturation is not so
great as to suppress the self-potential, and (4) the flow potential
variations are negligible, differences in self-potential within a sand
formation should be directly proportional to the interstitial content of
surface-active clay minerals. It is likely that the amount of
surface-active clay is proportional to the total interstitial material
which is, in turn, related to the conditions of deposition. The weaker
the depositing current, the finer the average grain size and the greater
the likelihood that fine material is deposited with the grains either as
interstitial material or as interlaminated layers.
The logic for the contention that
depositional conditions are reflected by the self-potential can be
summarized as follows:
*Caution
should be used in the interpretation of thickness and number of sand
laminae or interbeds, for there is a lower limit beyond which the
self-potential does not record the thickness accurately. This may be in
the order of 1 foot or less.
The observed self-potential
characteristics of sand formations are far more systematic than one
would expect from the seemingly tenuous explanation just advanced. In
many sand bodies the correlation is good between vertical grain-size
distribution and the SP deflection.
The resistivity curves of
petroleum-bearing sands may also reflect grain-size differences, because
resistivity is primarily a function of hydrocarbon saturation, other
factors such as mud resistivity and degree of cementation being equal.
Because of capillary forces, saturation is directly related to pore
size, within limits, and pore size in relatively uncemented sands is
proportional to grain size.
The relationships predicted by this line
of reasoning are not as common as one would expect. The main reasons for
this are that (1) hydrocarbon saturation for a given pore-size
distribution is a direct function of distance above the free water
level, and (2) invasion of resistive mud filtrate into the formation
obscures the true resistivity, as indicated on the normal curves.
The interpretation of sand genesis is
based on the recognition of certain significant properties of the sand
determinable from the SP curve. The following four pertinent properties
can be determined from the SP curve:
1) Homogeneity of the sand unit; the
sand unit may be comparatively massive without shale interbeds, or it
may consist of interbedded sand and shale.
2) Vertical variation of
grain size or degree of interbedding of shale;
the grain size of the sand or
thickness of shale interbeds may increase or decrease in a systematic
and characteristic manner in a direction normal to the bedding.
3) Nature of the lower contact;
the lower sand-shale contact
may be gradational or abrupt.
4) Nature of the upper contact;
the upper sand-shale contact
may be gradational or abrupt.
These four properties of a sand unit are
not mutually exclusive. Sand and shale interbeds may be thought of as
zones of marked grain-size change, and a gradational sand-shale contact
is a function of vertical sequence of grain size or thickness of
interbeds. Notwithstanding this interrelationship, no two of the
parameters are equivalent. The determination of the properties listed
above is believed to be genetically significant and adequate for the
estimation of mode of formation for many sand bodies.
Return
to top.
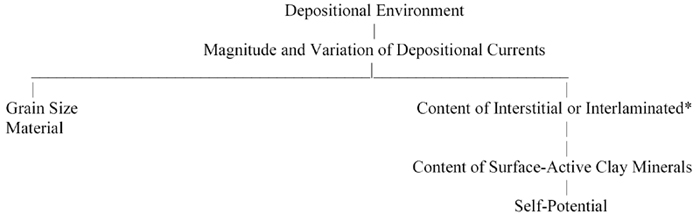
Symmetrical Descriptive
Classification
The close relationship of the shape of
the SP curve to certain lithologic properties indicates that a
classification of characteristic SP log shapes is at the same time a
classification of lithologic parameters. If these parameters are
genetically significant, a classification of some common SP log shapes
might aid in the interpretation of the origin of a sand from the
electric log.
A genetically significant classification
of SP log shapes can be made on the basis of (1) the degree of
interbedding and (2) the nature of the sand-shale contacts. A relatively
homogeneous sand with few or no shale interbeds is indicated by an SP
deflection with a smooth curve. A sand unit consisting of
interbedded sand and shale has a serrate SP curve. A sharp
sand-shale contact is indicated by an abrupt change in the SP
curve. A gradual change from sand to shale is marked by a progressive
decrease in the magnitude of the SP deflection--a gradational
change toward the shale line.
Although the qualities of the SP log
described above are assumed to reflect genetically significant
properties of sand bodies, the classification of SP log shapes is
objective in that it is based only on observable characteristics of the
log. On the basis of a smooth or serrate SP curve, indicating presence
or absence of sand-shale interbeds, and abrupt or gradational SP curve
boundaries, related to the nature of the sand body contacts, the basic
SP log shapes have been arranged as shown in Figure 1.
This classification is systematic and
precise and affords a complete and symmetrical arrangement of the basic
SP log shapes. For these reasons the classification has considerable
appeal, but it has the disadvantage of a somewhat involved and unwieldy
terminology. As each basic SP shape is distinguished on the basis of
three criteria, a lengthy phrase, such as "serrate curve with an abrupt
upper and gradational lower boundary," must be used to describe it. To
rectify this, short and systematic abbreviations, such as "A/G Sm or A/A
Se," are offered for each basic SP shape. The abbreviations are a
convenience for plotting SP log shapes on maps and afford a more precise
way to describe thick complex log shapes such as "G/G Se/Sm/Se.”
Abbreviations appear to satisfy the terminology requirements of
personnel continually working with log shapes, but for those not
actively engaged in such studies, abbreviations may be awkward and
unhandy to use. The symmetry of the classification, although admirable
from the point of view of organization and ease of remembrance, has
resulted in two theoretical basic SP log shapes, "G/G Sm and G/G Se" of
Figure 1, for which no natural examples have as yet been found.
Simplified Descriptive Classification
An alternative classification, although
somewhat arbitrary and less systematic and precise, is offered on the
basis of greater simplicity of terminology and facility for
communication (Figure 2). The SP curve for a massive sand unit is
smooth and for an interbedded sand unit is serrate. A bell-shaped
SP curve indicates a vertical sequence of decreasing grain size and/or
thickness of interbeds upward and an abrupt lower contact; a .funnel-shaped
SP curve indicates increasing grain size and/or thickness of
interbeds upward and an abrupt upper contact; a cylinder-SP curve
indicates no systematic change in grain size or thickness of interbeds
and abrupt upper and lower contacts.
The words "bell," "funnel," and
"cylinder" are used as nouns and "smooth" and "serrate" as modifying
adjectives, and this combination affords a simple and convenient
terminology. Moreover, these names should create mental images which
make them easy to remember and use. The SP deflection on the electric
log can be thought of as a two-dimensional representation of conditions
in three dimensions in the strata. The` surface resulting from rotation
of the SP curve about the well bore as an axis is a true image of the
stratal properties. Such three-dimensional surfaces are aptly described
by the terms "bell," "funnel," and "cylinder" (Figure 3).
SAND BODY-CONCEPTS AND TERMINOLOGY
Definition of Sand Body or Sand Zone
In this report a sand zone or
sand body is defined as a more or less well-defined interval
composed essentially of sand (Figure 4). In the definition the need for
a general term, the previous use of the term, and the limitations of
subsurface techniques have been considered. In subsurface work, contacts
between different lithologies, either abrupt or gradational, can
normally be recognized. On the other hand, the contact of one sand on
another is difficult to determine and normally goes unrecognized.
Consequently, a sand body, as broadly defined above, may be a simple
sand unit of one origin or it may be a composite sand unit consisting of
several sands of diverse origin. The ability to predict sand properties
from an understanding of sand origin depends in part on the simplicity
or complexity of the depositional history. It is important to
distinguish between a sand deposited in a single occurrence of a
particular environment from a sand deposit which contains sand-on-sand
contacts and was built up during reoccurrences of the same environment
or in different superposed environments.
Return
to top.
Depositional Regimen of a Sand
The origin of sediments is most commonly
related to environment of deposition.
Depositional environment (def.) - the
aggregate of all external conditions and influences affecting or
associated with the deposition of a particular interrelated sedimentary
sequence (includes all physical-chemical and organic-inorganic effects).
Depositional environment is a general
all-inclusive term used in connection with many diverse processes. In
connection with the origin of sand deposits, a word with more restricted
meaning is needed, and the more precise term "depositional regimen" is
proposed.
Depositional regimen (def.) - an
individual system of interrelated and interacting currents with
characteristic velocities, directions, and stabilities, and the
associated transportation and deposition of sedimentary particles which
give rise to a characteristic type of sand body with particular internal
sequence, texture, and sedimentary structures.
The depositional currents appear to be
of paramount importance in the development of the external form and
internal features of a sand body. Other environmental processes and
conditions are either of subordinate importance, or their effect, though
considerable, is comparatively indirect. Such factors as the salinity,
pH and Eh of an environment are not of prime importance. On the other
hand, water depth and tectonic activity in the sedimentary basin and
source area are of great importance, but their influence is indirect.
The type, strength, direction, and locale of currents are in some degree
functions of water depth and tectonics, which, thereby, are included in
some degree and partially reconciled in the concept of depositional
regimen.
Major Classes of Sand Bodies
Sand
bodies or sand zones can be divided conveniently into three major
classes on the basis of their mode of development.
1)
Genetic sand unit
- a sand body deposited during a single
occurrence of a particular depositional regimen.
2)
Amplified sand unit - an
aggradational sand body consisting of superposed sands deposited during
reoccurrence of a particular depositional regimen.
3)
Hybrid sand unit - an
aggradational sand body consisting of superposed sands deposited in more
than one kind of depositional regimen.
The major classes of sand bodies are
divided into types on the basis of whether deposition is accompanied by
nearly concurrent erosion, "cut and fill," or is mainly "fill-in"
without significant erosion. In general, "cut and fill" deposition
occurs more under continental conditions and "fill-in" more under
marine. These types of sand bodies are subdivided into categories on the
basis of origin in a distinctive depositional regimen or in a particular
combination of depositional regimens (Figure 5).
CHARACTERISTIC SP LOG SHAPES OF SAND
UNITS
A particular SP log shape is a
reflection of the properties of a stratal sequence which is in turn the
product mainly of the current conditions at the time of deposition. If
the depositional currents constitute a definite current system, and this
system is of common occurrence, the corresponding stratal sequence will
also be common. The SP log shapes described here are believed to be
characteristic of familiar often-repeated sandstone sequences relatable
to known depositional regimen.
The authors have utilized the combined
experience of Shell geologists who have studied Recent sediments and
ancient strata in outcrop and in the subsurface, and have prepared
idealized illustrations for the different types of sand units showing
the relationship of SP shape to lithology and the responsible
depositional processes (Figures 6,
7, 8,
9, 10 ,and
11). Some of the
pictured relationships are firmly established. Others are put forth more
as probabilities than as actualities.
SP logs have been made in Recent
sediments with a Widco logger (Bernard, Major, and Parrott, 1958a;
1958b; Bernard, Major, Parrott, and Anderson, 1958), and examples
typical of genetic sand units are shown in Figure 12. From normal
operational electric logs, SP log shapes characteristic of different
types of sand units have been collected in Figures
13, 14,
15, 16,
17,
18, 19,
20, 21,
22, and 23 (Table 1).
Table 1. Subsurface Examples of
Characteristic SP Log Shapes
Genetic Sand Units
Cut and Fill
Alluvial and
Alluvial-Deltaic Point Bar (Figures 13 and
14)
Distributary
Channel Fill (Figure 15)
Offlap Fill-in
Delta-Marine Fringe (Figure 16)
Barrier Bar
(Figure 17)
Cut and Onlap
Transgressive
Sand on Unconformity (Figure 18)
Amplified Sand
Units
Cut and Fill
Buildup in
Alluvial Valley or Alluvial Plain (Figure 19a)
Offlap Fill-in
Delta-Marine
Fringe Buildup (Figure 19b-19e)
Barrier Bar
Buildup (Figure 20)
Fill-in
Submarine
Canyon Fan (Figure 21a)
Turbidity
Current Buildup of Graded Beds (Figure 21b-21d)
Hybrid Sand Unit
Systematic
Progradation
of Alluvial Buildup over Shoreline Deposits (Figure 22)
Progradation
of Distributary Channel Sands through and over Delta Marine Fringe Sands
(Figure 23a-23c)
Marine
Transgressive Sand on Delta-Marine Fringe Sand (Figure 23d)
Return
to top.
Figure Captions (12-30)
 Figure 12 - Selected SP Log Shapes in
Recent Sands Figure 12 - Selected SP Log Shapes in
Recent Sands
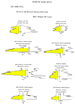 Figure 13 - Subsurface Examples of
Bell-Shaped SP Logs in Alluvial and Alluvial-Deltaic Point Bar Sands Figure 13 - Subsurface Examples of
Bell-Shaped SP Logs in Alluvial and Alluvial-Deltaic Point Bar Sands
 Figure 14 - Subsurface Examples of
Cylinder-Shaped SP Logs in Alluvial Deltaic Point Bar Sands Figure 14 - Subsurface Examples of
Cylinder-Shaped SP Logs in Alluvial Deltaic Point Bar Sands
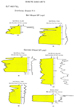 Figure 15 - Subsurface Examples of Bell-
and Cylinder-Shaped SP Logs in Distributary Channel Sands Figure 15 - Subsurface Examples of Bell-
and Cylinder-Shaped SP Logs in Distributary Channel Sands
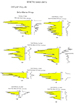 Figure 16 - Subsurface Examples of
Serrate Funnel-Shaped SP Logs in Delta-Marine Fringe Sands Figure 16 - Subsurface Examples of
Serrate Funnel-Shaped SP Logs in Delta-Marine Fringe Sands
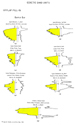 Figure 17 - Subsurface Examples of
Smooth Funnel-Shaped SP Logs in Barrier Bar Sands (17c after Barnett,
1941; 17d after Best, 1941) Figure 17 - Subsurface Examples of
Smooth Funnel-Shaped SP Logs in Barrier Bar Sands (17c after Barnett,
1941; 17d after Best, 1941)
 Figure 18 - Subsurface Examples of the
Electric Logs of Transgressive Sands on Unconformity Figure 18 - Subsurface Examples of the
Electric Logs of Transgressive Sands on Unconformity
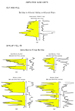 Figure 19 - Subsurface Examples of SP
Log Shapes in Alluvial Valley Buildup and Delta-Marine Fringe Buildup Figure 19 - Subsurface Examples of SP
Log Shapes in Alluvial Valley Buildup and Delta-Marine Fringe Buildup
 Figure 20 - Subsurface Examples of SP
Log Shapes in Barrier Bar Buildup (from A.R. Campbell) Figure 20 - Subsurface Examples of SP
Log Shapes in Barrier Bar Buildup (from A.R. Campbell)
 Figure 21 - Subsurface Examples of SP
Log Shapes in Submarine Canyon Fan and Turbidity Current Buildup of
Graded Beds Figure 21 - Subsurface Examples of SP
Log Shapes in Submarine Canyon Fan and Turbidity Current Buildup of
Graded Beds
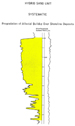 Figure 22 - Subsurface Example of SP Log
Shape in Progradation of Alluvial Buildup over Shoreline Deposits Figure 22 - Subsurface Example of SP Log
Shape in Progradation of Alluvial Buildup over Shoreline Deposits
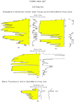 Figure 23 - Subsurface Examples of
Progradation of Distributary Channel Sands through and over Delta-Marine
Fringe Sands and Marine Transgressive Sand on Delta-Marine Fringe Sand Figure 23 - Subsurface Examples of
Progradation of Distributary Channel Sands through and over Delta-Marine
Fringe Sands and Marine Transgressive Sand on Delta-Marine Fringe Sand
 Figure 24 - Transverse Section of
Alluvial or Alluvial-Deltaic Point Bar Sandstone Unit, Upper Cretaceous
Muddy Sandstone, Cheyenne County, Nebraska Figure 24 - Transverse Section of
Alluvial or Alluvial-Deltaic Point Bar Sandstone Unit, Upper Cretaceous
Muddy Sandstone, Cheyenne County, Nebraska
 Figure 25 - Transverse Section of
Alluvial-Deltaic Point Bar Sandstone Unit, Upper Cretaceous, Tuscaloosa
Q Sand, Little Creek Field, Louisiana Figure 25 - Transverse Section of
Alluvial-Deltaic Point Bar Sandstone Unit, Upper Cretaceous, Tuscaloosa
Q Sand, Little Creek Field, Louisiana
 Figure 26 - Isopach Map and Longitudinal
Section of Distributary Channel Sand Unit, Upper Miocene G2
Sand, Main
Pass Block 35 Field, Louisiana Figure 26 - Isopach Map and Longitudinal
Section of Distributary Channel Sand Unit, Upper Miocene G2
Sand, Main
Pass Block 35 Field, Louisiana
 Figure 27 - Isopach Map and Longitudinal
Section of Distributary Channel Sand Unit, Miocene M Sand, West Lake
Verret Field, Louisiana Figure 27 - Isopach Map and Longitudinal
Section of Distributary Channel Sand Unit, Miocene M Sand, West Lake
Verret Field, Louisiana
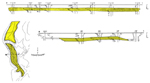 Figure 28 - Isopach Map and Longitudinal
and Transverse Sections of Barrier Bar Sand Unit, Upper Miocene, T1
Sand, South Pass Block 24 Field, Louisiana Figure 28 - Isopach Map and Longitudinal
and Transverse Sections of Barrier Bar Sand Unit, Upper Miocene, T1
Sand, South Pass Block 24 Field, Louisiana
 Figure
29 - Transverse Section of Alluvial Valley Fill, Pennsylvanian "5300-Ft"
Sand, Denton Creek Field, Texas Figure
29 - Transverse Section of Alluvial Valley Fill, Pennsylvanian "5300-Ft"
Sand, Denton Creek Field, Texas
 Figure 30 - Longitudinal and Transverse
Sections of Hybrid Sand Unit; Shallow Marine Sand Characterized by the
Even Upper Contact of the Sand, and Distributary Channel Fill
Characterized by the Very Irregular Lower Contact Figure 30 - Longitudinal and Transverse
Sections of Hybrid Sand Unit; Shallow Marine Sand Characterized by the
Even Upper Contact of the Sand, and Distributary Channel Fill
Characterized by the Very Irregular Lower Contact
Genetic Sand Units
Genetic sand units are principally of
two main types, "cut and fill" and "offlap fill-in." "Cut and fill" sand
units are those deposited in channels incised into the underlying strata
by currents of the depositional regimen. "Offlap fill-in" sands are
accreted to the coast in pre-existing depositional localities. Less
abundant and less understood are "onlap" sand deposits and "fill-in"
sands which may build up with little indication of offlap or onlap
deposition. The major genetic sand units are listed by type in
Figure 5.
Cut and Fill Sand Units
On the electric log, these sands are
characterized by an abrupt basal contact produced by erosion and
subsequent deposition of sand on shale.
Alluvial point bar sand unit
(Figure 7a) - characterized by a smooth
or slightly serrate bell-shaped SP curve resulting from an abrupt lower
contact, decrease in grain size upward, and gradational upper contact.
The bell-shaped curve is generally smooth, but the upper part tends to
be slightly serrate because of thin shale interbeds.
The alluvial point bar sequence and
characteristic SP log shape have been well established by studies of
Recent deposits in the Brazos River (Figure 12) (Bernard and Major,
1956b; Bernard, Major, and Parrott, 1958b; Bernard, Major, Parrott, and
Anderson, 1958) and of subsurface examples (Figures
13, 24) (Nanz,
1956).
Alluvial-deltaic point bar sand unit
(Figure 8a) -
characterized by smooth bell-shaped or cylinder-shaped SP curve
resulting from an abrupt lower contact, a slight decrease in grain size
upward, and an abrupt or slightly gradational upper contact.
The alluvial-deltaic point bar sequence
and characteristic SP shape have been observed in the modern upper
deltaic plain of the Rio Grande (Figure 12) (Bernard, Major, and
Parrott, 1958a; 1958b; Bernard, Major, Parrott, and Anderson, 1958), and
in the subsurface in the Oligocene Frio, Seeligson field, south Texas (Nanz,
1950; Stevenson, 1958), the Upper Cretaceous Tuscaloosa, Little Creek
field, southwest Mississippi,and elsewhere (Figures
13, 14,
25).
Return
to top.
Distributary channel sand unit
(Figures 8b,
11b) -
characterized by several SP shapes. A somewhat serrate bell-shaped SP
curve, representing abrupt lower contact, sand and shale interbedding
with upward decrease in grain size or thickness of interbeds, and a
gradational upper contact, is representative for some distributary
channel sands. Such sands may result from gradual filling of the channel
by progressively weaker depositional currents.
This type of distributary channel
sequence and the bell-shaped SP log have been observed in the subsurface
(Figures 15a, 15b, 26) (Bowling, 1958; Shelton and Parrott, 1958; Wilson
and Parrott, 1958).
Another type of distributary channel
sand unit, believed to be common in the Miocene of the Gulf Coast, is
represented by smooth and serrate cylinder-shaped SP curves. The two
shapes may be intermingled throughout the sand unit, or one or the other
may predominate. The smooth cylinder-shaped SP indicates a homogeneous
sand with an abrupt lower erosional contact and an abrupt upper contact;
the serrate cylinder represents sand and shale interbeds with an abrupt
lower erosional contact and an abrupt upper contact. Much of the
deposition probably occurred at the bottom of the channel, and the
formation of a thick deposit was possible because of continuous
subsidence during deposition. The distributary sand units which contain
both serrate and smooth cylinder-shaped SP curves apparently were
deposited in channels with nonuniform current velocities resulting in
contiguous deposition of sands and silty clays (Figure 8b).
In some cases a generally smooth
cylinder-shaped SP may have a gradational upper boundary represented by
a relatively thin zone of serrate bell-shaped SP development in the
upper part of the sand (Figure 11b). Such an SP curve may represent distributary channel deposition coincident with subsidence in the lower
part and distributary channel fill due to abandonment in the upper part.
In distributary channel sand units, the
types of SP log shapes and their distribution have not been adequately
investigated and are only partially understood. The SP log shapes
described are characteristic of distributary channel deposits which have
been observed in subsurface examples (Figures 15,
27) (Bowling, 1958;
Harris, 1958; Wilson and Parrott, 1958). The suggested processes of
deposition are interpretive and may require considerable modification in
the future. A coring program, which will improve our understanding of
deposition in distributary channels, is now in progress in Recent
distributaries of the Mississippi Delta complex (Bernard, Project
211,110, personal communication).
Offlap Fill-in
Delta-marine fringe sand unit
(Figure 7b) - characterized by
serrate funnel-shaped SP curves, indicating a gradational lower contact,
sand and shale interbedding with a general upward increase in thickness
of beds and grain size, and an abrupt upper contact. The interbeds of
sand and shale are related in large part to the flood cycles, sand being
deposited by the stronger currents of flood stages and silty clays by
the weaker currents of low water stages. The upward increase of grain
size and thickness of beds is a function of the progressive decrease in
distance between the depositional site and the distributary mouth source
as a result of normal deltaic advance.
If the shale interbeds are less than one
or two feet thick, the serrate character may be subdued so that the SP
curve resembles the smooth funnel of a barrier bar.
Considerable data on Recent delta-marine
fringe sands have been gathered (Figure 12) (Bernard, Major, and
Parrott, 1958a; 1958b; Bernard, Major, Parrott, and Anderson, 1958), and
work is continuing. Fringe sands are very abundant, especially in the
Gulf Coast, and numerous subsurface examples have been observed (Figure
16) (Bowling, 1958; D’Olier, 1959; Harris, 1958; LeBlanc et al., 1959;
Wilson and Parrott, 1958).
Barrier bar sand unit
(Figure 7c) - distinguished by a
generally smooth funnel-shaped SP curve which is produced by a
homogeneous sand increasing moderately in grain size upward and having a
gradational lower contact and an abrupt upper contact. The gradation in
grain size is most probably directly related to decreasing wave energy
with increasing water depth. The wave and longshore currents which
deposit barrier bars appear to be more constant and uniform than most
other sand-depositing current systems, and, consequently, the smooth
funnel is probably the most nearly diagnostic SP shape.
Barrier bars with smooth funnel-shaped
SP curves have been observed in the Recent (Figure 12) (Bernard,
Major, and Parrott, 1958a; 1958b; Bernard, Major, Parrott, and Anderson,
1958) and are fairly numerous in the subsurface (Figures
17, 28) (Conybeare,
1956; Wilson and Parrott, 1958).
Cut and On lap
Transgressive sand on unconformity
(Figure 7d) - the
classical sequence above an unconformity, conglomerate or coarse
sandstone grading upward into fine sandstone and siltstone, might be
expected to have a fairly smooth bell-shaped SP curve representing an
abrupt lower erosional contact, few or no shale interbeds, and a
gradational upper contact.
Such sequences have been observed and
are probably most common in orogenic basins where large headlands are
exposed to and cut back by vigorous wave action (Stokesbary, 1958). The
headlands must contain materials capable of supplying coarse detritus in
order for conglomerates and coarse sandstones to be deposited on the
unconformity, and subsidence must accompany transgression for a thick
deposit to form. Although the figured SP shape has not yet been
observed, it should be expected and watched for, particularly in
orogenic-type basins.
In a paralic-type basin such as the Gulf
Coast, most transgressive units are thin deposits of fine sand or silt
and have no characteristic SP log shape. However, transgressive sands
tend to be uniform over comparatively large areas and are often used as
correlation datums. If, after the examination of a number of electric
logs, the top of a thin sand appears to be uniform so as to afford a
possible datum, the sand is most probably a transgressive unit. In some
cases, the SP development in a transgressive deposit indicates a
characteristic lateral gradation from silt to sand in a shoreward
direction (Figure 18e and 18f). Transgressive sands are normally
rich in calcareous fossil material and are slightly coarser grained and
more poorly sorted than closely associated regressive sands.
Consequently, they may be characterized on the electric log by a higher
resistivity (Figure 18a, 18b, 18c, and 18d) or by fluid invasion (Figure
4).
The properties of some transgressive
sands have been investigated in the Recent (Bernard, Major, Parrott, and
Anderson, 1958), and in the subsurface (Andrews and Eastin, 1958;
Bowling, 1958; Harris, 1958; LeBlanc et al., 1959; Nanz, 1957; Shelton
and Parrott, 1958).
Amplified Sand Units
Important types of amplified sand units
are built up by "cut and fill," by "offlap fill-in," and by "fill-in"
with no particular relationship to the position of the shoreline. "Cut
and fill" deposits are represented by thick formations of sandstone
which were deposited on an alluvial plain. "Offlap fill-in" deposits of
large size have been formed by superposition of deltaic sediments
because of subsidence during progradation of the delta and by
aggradational buildup of barrier bars. The most important "fill-in"
deposits are submarine canyon fans and graded bed sequences deposited by
turbidity currents.
Return
to top.
Cut and Fill
Point bar buildup in alluvial valley or
on alluvial plain (Figure 9a)
- characterized by a fairly smooth composite SP curve, the lower and
larger portion cylinder-shaped and the upper portion bell-shaped. The
contact relationships and overall sequence are the same as in the
genetic unit, but the coarser basal sands are much thicker. This thick
development is accomplished by the return of the depositing stream to
the area at successively higher base levels. At each new level the
depositing stream selectively removes fine sands and silty sands because
these fine materials occur in the upper part of the point bars deposited
by the preceding stream. Because the depositing stream has a higher base
level, it deposits the coarse lower material of the point bars in a
position laterally equivalent to that of the fine upper sands being
removed from the preceding point bars. In this way, a considerable
thickness of coarse point bar gravels and sands can be built up with
only a comparatively thin interval of fine-grained sands and silty sands
on top.
Alluvial buildups largely of point bar
deposits are common in the geologic column (Figures
19a and 29) (Nanz,
1957).
Offlap Fill-in
Delta-marine fringe buildup
(Figure 9b) - represented by an SP curve
consisting of several adjoining serrate funnels. The division between
one funnel and another is not large, and such divisions can seldom be
carried very far laterally. Consequently, the funnels are necessarily
grouped together as one sand body. Each individual funnel is believed to
represent a phase of fringe sand deposition during deltaic advance. One
funnel succeeds another because of a local halt in deposition, a minor
delta retreat due to continuing subsidence, and resumption of deposition
and delta advance. A limited area is affected at any one time, but
apparently such processes can result in large and complex sand bodies
consisting largely of buildup of delta-marine fringe sands.
Delta-marine fringe buildups are especially abundant in the subsurface
Miocene of the Gulf Coast (Figure 19b, 19c, 19d, and 19e) (Bowling,
1958; D’Olier, 1959; Wilson and Parrott, 1958).
Barrier bar buildup
(Figure10a) - represented by a series of
partially separated smooth funnel-shaped SP curves or by an
exceptionally thick smooth cylinder-shaped SP with a gradational lower
contact and an abrupt upper contact. In the latter case, the individual
barrier bars are so completely merged that their individual identity is
lost. Such barrier bar buildups should be expected in interdeltaic areas
where the position of the shoreline has been stabilized for a
considerable period by tectonic control.
Barrier bar buildups have been reported
in the Tertiary of California (Castano, 1955) and in the Oligocene Frio
of Texas along the Vicksburg flexure (Figure 20) (Lohse, 1955).
Fill-in
Submarine canyon fan
- may be represented by a thick smooth
or slightly serrate cylinder-shaped SP curve. Both the lower and upper
contacts are normally abrupt. There is no orderly sequence in the fan,
which consists predominantly of very poorly to moderately sorted coarse
conglomerates and cobbly mudstones (isolated pebbles and cobbles in a
mud matrix).
The fan develops in relatively deep
water at the break of slope near the foot of a submarine canyon. It
consists of the initial deposits from relatively high velocity turbidity
currents flowing down the submarine canyon and contains the coarsest
materials transported by the currents because these are deposited at the
first break in slope.
These deposits have been observed in
outcrops and in subsurface strata of Tertiary age in California (Figure
21a) (Castro, 1957; Hsu, 1957; Hsu and Castro, 1957; Taylor, 1954).
Graded bed buildup by turbidity currents
(Figure 10b) - the graded bed
is the genetic unit of most turbidity deposits, but as a genetic unit it
is too thin and too indistinctly separated from other graded beds to be
useful. Consequently, the sand body formed by turbidity currents is a
buildup consisting of superposed graded beds.
A buildup
of graded beds is characterized by slightly serrate or smooth
cylinder-shaped SP curves which may range from thin to very thick.
Whether the SP curve is slightly serrate or smooth may be in large part
a matter of log quality. The slightly serrate cylinder is the ideal
shape. The serrations represent the individual graded beds; the abrupt
upper and lower contacts are produced by sharp boundaries between the
graded bed sequence and the overlying and underlying deep water, fine
grained shales.
Graded beds deposited by turbidity
currents have been studied in the Recent, but have been most thoroughly
investigated in outcrops and in the subsurface (Figures 21b, 21c, 21d) (Castano,
1957; Castro, 1957; Hsu, 1957; Hsu and Castro, 1957, Taylor and
Pontius, 1958.
Hybrid Sand Units (Systematic)
Certain hybrid sand units appear to
develop through a definitive sequence of events and can be termed
"systematic." Some systematic hybrid sand units can be recognized from
their appearance on the electric log.
Progradational Buildup of Alluvial Sands
over Delta-Marine Fringe
(Figure 11a)
The characteristic SP shape is compound,
with the lower part a serrate funnel and the upper part a fairly smooth
bell. Both the lower and upper contacts are gradational, but the
gradation should take place over a long interval at the base and a
considerably shorter interval at the top. A comparatively thick interval
of massive sand, represented by a smooth cylinder-shaped SP may occupy
the central portion of the sand body. Such a massive sand zone should
consist of the better developed sands from the upper portion of the
fringe sequence together with the thick lower sands of the overlying
alluvial sequence. The grain size and thickness of beds increase upward
into the alluvial sands and then decrease.
The progradational sequence of alluvial
sands on delta-marine sands has been observed in outcrop studies, but
the corresponding SP shape has not been verified. As the sequence does
exist, the SP shape described is to be expected and looked for. An
example of progradation buildup of alluvial sands over shoreline
deposits has been described (Figure 22) (LeBlanc and Rainwater, 1957).
Return
to top.
Progradation Laterally of Distributary
Channels through Delta-Marine Fringe
(Figure 11b)
The characteristic SP curves are
laterally equivalent with different character-serrate funnels
representing delta-marine fringe and serrate to smooth bells and
cylinders distinguishing distributary channel sands. Such an association
is the normal situation in deltaic deposits. During deltaic progression,
distributaries advance toward the sea by cutting their way through
pre-existing deltaic sediments. As the distributary channels normally
cut deep into the subaqueous deltaic sediments, most fringe sands are
dissected by distributary channel sands.
Distributary channel sands with
laterally equivalent delta-marine fringe have been observed in the
Recent (Bernard, Major, and Parrott, 1958b; Bernard and Parrott, 1958;
Bernard, Major, Parrott, and Anderson, 1958) and are abundant in the
subsurface Tertiary strata of the Gulf Coast (Bowling, 1958; D’Olier,
1959; Harris, 1958; LeBlanc et al. 1959; Shelton and Parrott, 1958;
Wilson and Parrott, 1958). In some cases the distributary channels have
prograded laterally through some fringe deposits and over others (Figure
23a, 23b, and 23c).
Marine Transgression over Delta
(Figure 11c)
After a delta has been abandoned and
deposition has ceased, compaction of the aqueous deltaic clays together
with continued basin subsidence causes a general marine transgression
over the deltaic area.
As the
sea transgresses, the upper part of the deltaic sequence is cut away by
wave action, and much of this material is redistributed as a
transgressive sand or silt on or near the unconformity. A transgressive
sand
may be in direct contact with the
underlying deltaic sands or may be separated by a thin bed of shale. A
transgressive sand in direct contact is difficult to distinguish on the
electric log, but the poorer sorting,
higher silt and clay content, and high
fossil content characteristic of a transgressive sand may be apparent in
a reduced SP and a high resistivity.
A thin persistent sand above a deltaic
sand body is immediately suspected as a transgressive deposit and may be
further characterized by a high resistivity.
Transgressive sands over deltaic
deposits have been extensively studied in the Recent (Bernard and Major,
1957; Bernard, Major, and
Parrott, 1958b; Bernard and Parrott, 1958) and in the subsurface
(Figures 23d and 30) (Bowling, 1958; D’Olier, 1959; Harris, 1958;
LeBlanc et al., 1959; Shelton and Parrott, 1958; Wilson and Parrott,
1958).
LIMITATIONS AND QUALIFICATIONS
At the present time, the origin of many
sand bodies can be successfully estimated from the character of the SP
log alone. This is possible because the SP log shapes have been
calibrated against known geologic conditions. However, the
interpretation of SP character requires qualification. For sand bodies
of different geologic ages and in different sedimentary basins from
those in which SP log shapes have been calibrated, additional
calibration may be necessary before interpretations of adequate
reliability can be obtained. The geologic calibration of an SP log
entails a paleontologic, petrologic, and sedimentologic study of samples
(conventional and sidewall cores and good cuttings) and correlation of
the results with the appropriate SP log shapes. The character of an SP
log must be calibrated satisfactorily before it can be used safely to
infer the origin of sand bodies.
In the determination of sand genesis, SP
log shapes are characteristic rather than diagnostic, and greater
precision and reliability are obtained by utilizing additional
information. Interpretations from the electric log should be made in
conjunction with sample data whenever possible. An SP log shape, which
permits several alternative interpretations, may become nearly
diagnostic when used in conjunction with other geological information.
For example,a smooth cylinder-shaped SP is characteristic of cut and
fill sand bodies in a delta, but if the shape is associated with a deep
water fauna it indicates a turbidity current deposit of graded beds. A
coordinated study of sample material along with SP character may result
in recognition of depositional cycles, a difficult feat from the study
of electric logs alone. Once the depositional cycle is recognized, the
origin of sand bodies can be more easily and accurately estimated from
the electric log. Even the depositional environment for shales may be
predictable, not that the SP curve of shale is characteristic, but
because the depositional sequence is understood.
Lack of information concerning basin
tectonics and paleogeography handicaps the estimation of sand origin.
Not until the stratigraphic framework is established for an area, as it
has been for many petroleum provinces, can the SP curve be used safely
to determine the probable origin of the sand bodies. The stratigraphic
framework of a basin gives some indication of the types of depositional
regimen which were active in the basin and of their general position
during different periods. Such information helps to eliminate
alternative interpretations of sand origin from the SP log.
The character of the SP log may not be
of genetic significance for all types of sand bodies or in all
depositional basins. Although a close correlation between vertical
distribution of grain sizes and deflections on SP logs has been found
for many sandstones, no such relationship has been found for
conglomerates or conglomeratic sandstones. Furthermore, the development
of an ideal SP log shape depends upon the presence of surface-active
clay minerals and the absence of distortions which might be produced by
extensive cementation and compaction. In certain basins which lack
significant amounts of montmorillonite, which is the most surface-active
clay, or where cementation and compaction effects are excessive, the
shapes of the SP curve may not as yet be interpretable. Basins in which
the character of the SP log is least usable are likely to be those which
contain older strata, especially Paleozoic. The montmorillonite clays
are much less abundant in the older strata, probably because of
diagenesis, and cementation and compaction effects commonly are more
severe.
It should be pointed out that this paper
is a beginning in SP log-shape interpretation, and no doubt improvements
in technique and additional calibrations under known geologic conditions
in other geologic provinces will eliminate some of the present
limitations. Even more promising, however, is the progress being made in
geological calibration and interpretation of other types and
combinations of geophysical logs (Eddy and Sneider, 1959).
Return
to top.
CONCLUSIONS
In many basins of deposition,
estimations of sand genesis can be made rapidly and inexpensively from
studies of self-potential logs. Considerable geologic information can be
obtained with a minimum of effort by such studies, and data can be
secured for wells from which no sample material is available.
The determination of sand genesis from
the electric log is an estimation and as such is subject to error. The
reliability of interpretation among other things is a function of the
precision with which the calibration of the SP log shapes has been
accomplished and of how much is known of basin tectonics and
paleogeography. Reliability can normally be improved by study of
appropriate sample material.
Sand bodies with characteristic SP log
shapes have been observed in Paleozoic and Mesozoic as well as Tertiary
strata. The techniques for determining sand genesis from the SP curve
are most widely applicable to younger sand bodies, which normally are
less affected by diagenetic changes, but are also satisfactory for some
older sand bodies.
REFERENCES
Andrews, G.W., and Eastin, J.E., 1958, The Environmental
Approach to Subsurface Geological Studies, West Lake Verret Field, St.
Martin Parish, Louisiana. Part II - Depositional History of Some Middle
Miocene Sediments, Shell TS Report 138, May 1958.
Archie, G.E., 1953, Practical Petrophysics. Part I -
Principles, Shell TS, Houston, Jan. 1953, p. V:C:1.
Barnett, D.G., 1941, O’Hern Field, Duval and Webb
Counties, Texas, in Stratigraphic Type Oil Fields: AAPG Special
Publication, p. 722-749.
Bernard, H.A., 1953, Application of Studies of Recent
Sediments to Older Rocks, Shell EPR Memo Report 13, Sept. 1955.
Bernard, H.A., and Major, C.F, 1956a, Application of
Studies of Recent Sediments to Older Rocks,
Shell EPR Memo Report 16, March 1956.
Bernard, H.A., and Major, C.F., 1956b, Sedimentary
Features Diagnostic of Alluvial Point Bar Sands, Shell EPR Memo Report
23, Oct. 1956.
Bernard, H.A., Major, C.F., and Parrott, B.S., 1958a,
with the cooperation of Project 21003, Late Quaternary Geology of
Southeast Texas, Field Guide, Shell EPR Geol. Misc. 1, revised May 1958
for Seminar on Clastic Sedimentary Environments (in press).
Bernard, H.A., Major, C.F., and Parrott, B.S., 1958b,
Recent Depositional Environments and the Principal Sand Facies of the
Northwestern Gulf of Mexico, prepared for Seminar on Clastic Sedimentary
Environments, May 12-23, 1958, Shell EPR Geol. Misc. 16 (in press).
Bernard, H.A., and Parrott, B.S., 1958, The Role of
Environmental Concepts in Subsurface Geology, Proc. Prod. Geol. Conf.,
Shell TS, Houston, Jan. 1958, p. 23.
Bernard, H.A., Major, C.F., Parrott, B.S., and Anderson,
M.A., 1958, Seminar Notes on Recent Depositional Environments and
Related Sediments and Faunas, Shell EPR Geol. Misc. 17, 1958.
Best, J.B., 1941, Lopez Oil Field, Webb and Duval
Counties, Texas, in Stratigraphic Type Oil Fields: AAPG Special
Publication, p. 680-697.
Bowling, D.D., 1958, The Environmental Approach to
Subsurface Geological Studies, West Lake Verret Field,
St. Martin Parish, Louisiana. Part I - Application to a
Detailed Study of V Sand, Shell TS Report 138,
May 1958.
Castano, J.R., 1955, Integrated Stratigraphic Analysis of
Gatchell Sand, Coalinga Area, California, Shell Pacific Coast Area Expl.
Misc.1017, 1955.
Castano, J.R., 1957, Nature and Genesis of the Stevens
Sand, San Joaquin Basin, California, Geol. Conf., Shell TS, Houston,
1957, p. 20.
Castro, M.J., 1957, Depositional Processes and
Environments of a Portion of the Pliocene of Ventura Basin, California,
Shell Pacific Coast Area Expl. Misc. 1377, May 1957.
Conybeare, C.E.B., 1956, Sandstone of North Central
Alberta Basin, Shell Calgary Area Monthly Expl. Report, January 1956, p.
18.
D'Olier, W.L., 1959, Upper Miocene Deltaic Sands, Head of
Passes Area, Louisiana, part of Shell EPR Geol. Misc. 22 by B.W. Wilson,
et al., 1959 (in press).
Eddy, R.E., and Sneider, R.M., 1959, Application of
PetrophysicaL Data to Geological Interpretations in Sandstone
Reservoirs, Shell EPR Memo Report, 1959 (in press).
Harris, R.S., 1958, Self-Potential Curve Shades as
Indicators of Depositional Environments, West Lake Verret Field, St.
Martin Parish, Louisiana, Shell EPR Report 516, Dec. 1958.
Hsu, K.J., 1957, Studies on Deep-Sea Sediments of the
Ventura Basin-A Summary, Shell EPR Memo Report 32, Oct. 1957.
Hsu, K.J., and Castro, M.J., 1957, Pliocene Deep Sea
Strata, Ventura Basin, California, Geol. Conf., Shell TS, Houston, April
1957, p. 18.
LeBlanc, R.J., 1950, Recent Depositional Environments of
Clastic Sediments and Related Sedimentary Facies of the Gulf Coast, A
Progress Report, Shell EPR Report 162, Oct. 1950.
LeBlanc, R.J., and Rainwater, E.H., 1957, Application in
Exploration of Criteria Derived from Research on Recent Clastic
Sediments of the Gulf Coast, Shell TS Report 117, April 1957, Figure 2.
LeBlanc, R.J., Rainwater, E.H., and Campbell, A.R., 1959,
Relationship of Regional Sand Patterns to Depositional Environments in a
Basin of Moderate Tectonic Activity and in a Paralic Realm of
Sedimentation, Shell EPR Report, 1959 (in preparation).
Lohse, E.A., 1955, Sedimentology of Subsurface
Miocene-Oligocene Series, Texas Gulf Coast F-H-11, Shell Houston Area
Report, 1955.
Major, C.F., and Bernard, H.A., 1956, Mississippi
River--South Pass Bottom Sediment Distribution, Shell EPR Memo Report
20, June 1956.
Nanz, R.H., 1950, Nature, Distribution, and
Interrelationships of Rock Properties in a Lens-Type Sandstone
Reservoir, Shell EPR Report 166, Dec. 1950.
Nanz, R.H., and Wilson, B.W., 1955, Monthly Summary
Progress Report, Shell EPR, Item 21003 - Studies of Sandstone
Reservoirs, June 1955, p. 10.
Nanz, R.H., 1956, Genesis and Trend of a Tuscaloosa Oil
Sand in the Wisner Field, Franklin Parish, Louisiana, Shell EPR Memo
Report 22, Sept. 1956.
Nanz, R.H., 1957, Evaluation of Magnetic Core Orientation
Method, Den ton Creek Field, Montague County, Texas, letter from Shell
Development Company to Shell Oil Company, Tulsa Area, October 2, 1957.
Shelton, J.W., and Parrott, B.S., 1958, Genesis and Trend
of G2 Sand Zone, Main Pass Block 35 Field, Louisiana, Shell EPR Report
490, June 1958.
Stevenson, W.L., 1958, Depositional Patterns of the Frio
Sands of the Seeligson Area, Shell EPR Report 518, Dec. 1958 (in press).
Stokesbary, W.A., 1958, Personal Communication on
Transgressive Sand Sequence in the Shell Pacific Coast Area, 1958.
Taylor, J.C., 1954, Personal Communication on Submarine
Fans in Upper Tertiary of Brea Canyon Field, Los Angeles Basin,
California, Shell Pacific Coast Area, 1954.
Taylor, J.C., and Pontius, D.C., 1958, Personal
Communication on Turbidity Current Deposited Graded Beds in the Saticoy
Field, Ventura Basin, California, Shell Pacific Coast Area, 1958.
Wilson, B.W.,
and Parrott, B.S., 1958, Sediment Distribution and Its Control in the
Lower Producing Sands, South Pass Block 24 Field, Louisiana (Abstract),
Proc. Prod. Geol. Conf., Shell TS, Houston, Jan. 1958, p. 43.
Return
to top.
|
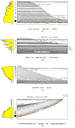 Figure 7 - Genetic Sand
Units; Idealized Examples of Alluvial Point Bar, Delta-Marine Fringe,
Barrier Bar, Transgressive Sand on Unconformity
Figure 7 - Genetic Sand
Units; Idealized Examples of Alluvial Point Bar, Delta-Marine Fringe,
Barrier Bar, Transgressive Sand on Unconformity