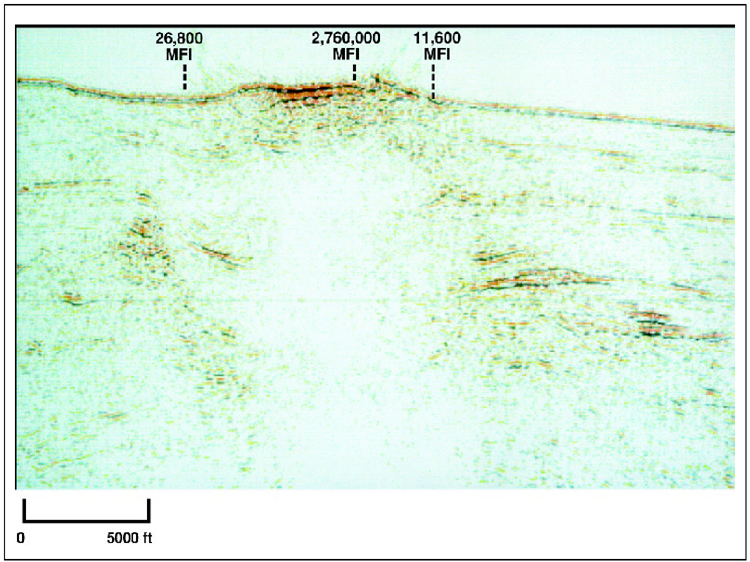
Figure 11. Example of a seismic line showing a close-up of a seafloor mound interpreted to represent a chemosynthetic community over the cross-stratal migration pathway illustrated in Figure 10. MFI values from nearby dropcores are projected onto the line.