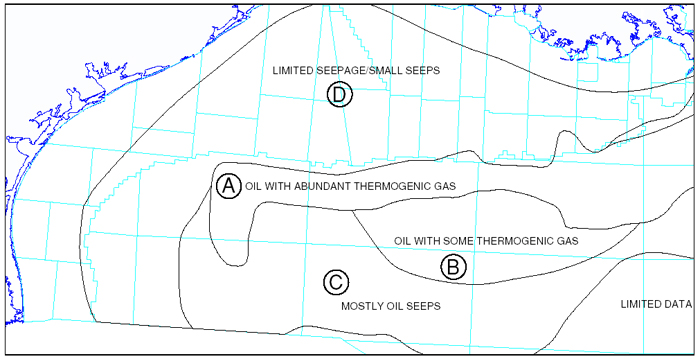
Figure 4. Gulf of Mexico regional seep-distribution map based on more than 5200 sea-bottom dropcores plus sea-surface slicks identified on remote-sensing data. (A) abundant/large oil seeps with prevalent thermogenic gas; (B) abundant/large oil seeps with less thermogenic gas; (C) abundant/large oil seeps with only limited thermogenic gas; and (D) limited hydrocarbon seepage. Within areas A, B, and C, nearly 75% of the sea-bottom dropcores contain moderate or substantial quantities of oil, compared with only about 12% within area D. Within area A, more than 25% of the oil-bearing sea-bottom dropcores also contain substantial quantities of thermogenic (headspace) gas, compared with less than 5% in area C.
Click here for sequence of Figure 2 (hydrocarbon-systems map) and Figure 4 (seep-distribution map).