Click on image to open larger version.
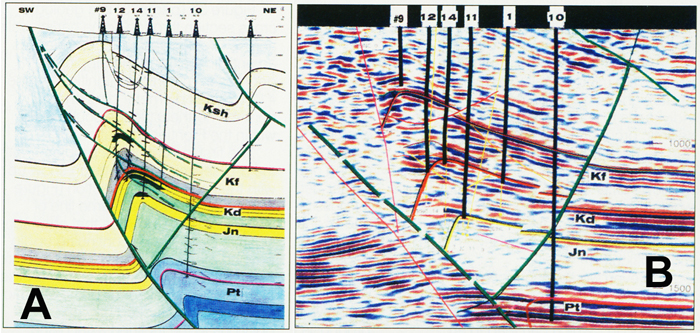
Figure 3. Detailed comparison of structural cross section using well data (a) to a 3-D seismic section (b). Note the location of steep dips and faulting based on wells vs. the interpretation of seismic reflectors. Kf is Cretaceous Frontier, Kd is Cretaceous Dakota, Jn is Jurassic Nugget and Pt is Permian Tensleep. Line of section in Figure 2.