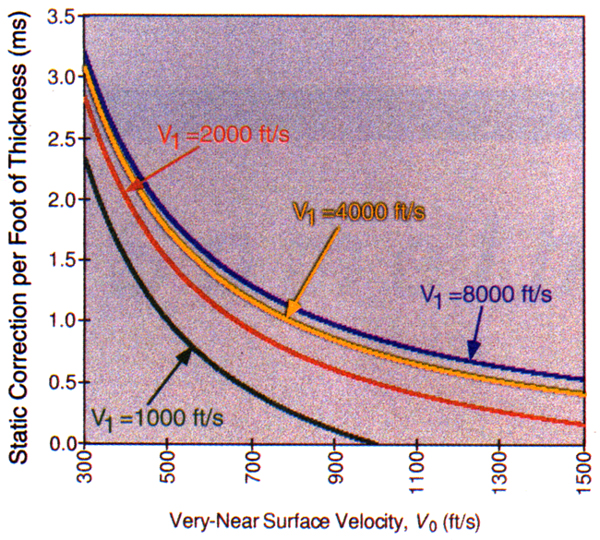
Figure 2. Static correction in ms/ft for various surface alluvial velocities (V0) and various underlying-layer velocities (V1). The situation modeled, and equation used, is shown in Figure 1. The static shifts for all V1 velocities above 8,000 ft/s are only slightly larger than for V1 = 8,000 ft/s.