|
Kinematic
Analysis in Plate Reconstruction
General Statement
An unfortunate
fact of geology is that most datasets, including seismic, rarely allow
for a unique interpretation of a geological problem.
Having
to wrestle with multiple working hypotheses is perhaps especially common
in the structural arena, where one or another of many theoretical models
of "ideal" crustal deformation can be made to fit a given structural
pattern. This can be frustrating and potentially costly if the optimum
exploration strategy is dependent upon the interpretation finally
chosen.
Integration of multiple and diverse data sets is one popular approach to
reducing the range of possible interpretations, the goal being to
minimize exploration risk. However, on too many occasions, if your
"best" data set can't give you a clear solution, then mixing in diverse
secondary data sets can muddle the picture even further. Worse, this
multifaceted picture may not be fully understood by anyone on the work
team, and the full implications of the "integrated solution," which will
provide the basis of the exploration model, might never be recognized.
It is
widely recognized that broadening the scale of geological assessment to
beyond the limits of the block or field can help to constrain a unique
solution to a given problem. Indeed, many plate tectonic and structural
processes evolve over scales far larger than most blocks, and to ignore
the larger scale can lead to serious misinterpretations. However,
broadening the scale of examination to beyond the block remains, in many
cases throughout industry, little more than a matter of describing what
is out there. In other words, mapping.
As
geologists, we all know that mapping is a key part of geology, but it is
very important to take the next step and understand how and why a given
set of mapped structures developed. Can this help to resolve our
interpretation of geological problems? Can it tell us anything more
about an exploration play? Can it trigger the identification of new
plays altogether? We believe it can.
When
we shift from trying to address the "what" questions of
structural analysis into the "how" questions, we move from static
description into time-progressive kinematic analysis.
Background
Kinematic analysis can be performed at all scales in geology -- from
mineral grains to tectonic plates -- and it embraces the motions of
material undergoing geological change. Defining the motions of the
plates and crustal blocks, where possible, can tremendously facilitate
understanding how certain types of structures developed.
Plate
kinematics addresses the history of motion of the plates and blocks that
comprise or have comprised the earth's surface. Although plate
kinematics is traditionally associated with the oceans, it also can be
applied successfully to areas of continental crust and margins of real
exploration interest. In the late 1960s, one of the most exciting early
realizations of the plate tectonic revolution was that the ways in which
plates move relative to each other, both past and present, are governed
by a firm set of predictive, or retrodictive, geometric rules. Plate
kinematics gave us the power to quantitatively open and close oceans,
collide continents and evolve plate circuits in area-balanced models.
Earth's geological history became an intellectual playground for "plate
pushers" who began to decipher Earth's global tectonic evolution.
However, all too often, these kinematic rules were either not applied,
misapplied or applied to inappropriate places, such that by 1980 many
journal articles, no matter what the discipline, ended with "bandwagon"
Plate Tectonic Interpretation sections, which correctly came to be
viewed as mere arm waving.
Similarly, industry decision-makers grew to be suspicious of such
tectonic scenarios -- with good reason -- and often ignored or
discounted them. Thus, the potential of kinematic analysis often was
never reached. Sadly, these very powerful rules are no longer even
taught in many universities, and quantitative plate kinematic analysis
is becoming something of a lost art. Very powerful plate kinematic
rules, however, do still exist. Kinematic analysis is a means of better
deciphering the structural history of basins.
Figure Captions
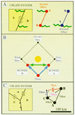 Figure
1. Examples of vector displacement diagrams for two and three-plate
systems. Figure
1. Examples of vector displacement diagrams for two and three-plate
systems.
 Figure
2. Relationships between pole of rotation, great circles, ridge
segments, small circles, transforms and fracture zones in a two-plate
system. Figure
2. Relationships between pole of rotation, great circles, ridge
segments, small circles, transforms and fracture zones in a two-plate
system.
Principles and Methods
First,
we review some of these principles to provide the basis for exploring
the power of kinematic analysis. In
Figure 1a, we show a simple
two-plate system in which block A moves NNE relative to B with time.
Displacement during the particular time interval of concern can be drawn
as shown by the red vector between the dots representing the plates. To
palinspastically restore the offset back in time, we would use the blue
vector to retract the accrued measured offset.
Progressing to a three-plate system, we must consider the motions
between the three pairs of plates. A simple analogy of this situation is
to consider, in
Figure 1b, two runners, A and B,
running from home plate to first and third base on a baseball diamond.
The displacement between home plate and runners A and B, respectively,
is NE and NW, but the relative motion between the two runners is
east-west. A plate boundary separating plates represented by the two
runners would be extensional, with net E-W fault displacements.
In the
three-plate example of
Figure 1c, we can restore, moving
back in time, two known offsets (A-C) and (A-B) to determine the unknown
offset between the third plate pair (B-C). The measured directions and
displacements of plates B and C are drawn relative to Plate A. Tieline
B-C will then approximate the net direction (NE) and displacement (76km)
of the common B-C fault zone. If this happens to be a thrust belt with
the orientation as shown, then the strike-slip (blue, 30km) and
convergent (red, 70km) components of net motion can be inferred by
construction of the right-triangle, thereby providing vital information
about overall structural style, with the expectation of dextral
transpressive (combination of strike-slip plus compression) strain
partitioning at that thrust belt.
Finally, in the larger two-plate example of
Figure 2, plates A and B diverge by
seafloor spreading at the ridge (red) and transcurrent motions at the
transform faults (green). The continuations of the transforms into
adjacent oceanic crust are fracture zones where differential thermal
subsidence occurs, but without active strike-slip faulting. Ridge
segments lie on great circles to the pole defining the plate separation,
whereas the transforms lie on small circles.
The
rate of plate separation and also of transcurrent displacement at the
transforms increases with distance from the pole. Transforms also become
straighter as distance increases from the pole of rotation.
In
this article these principles will be applied to two well known oil
provinces, Colombia/western
Venezuela
and the Gulf of Mexico, showing how formal kinematic analysis can offer
some of the most sound constraints available to guide and to favor
certain geological interpretations over others. Further, it can provide
the basis for defining or rejecting play concepts, therefore strongly
influencing exploration strategy.
Return
to top.
Kinematics
as Key to Unraveling Basin Histories
Figure Captions
 Figure
3. Map of northern
South America showing main crustal blocks, separated by lithospheric fault
zones, under relative motion during Late Oligocene to Recent Andean
Orogeny. Figure
3. Map of northern
South America showing main crustal blocks, separated by lithospheric fault
zones, under relative motion during Late Oligocene to Recent Andean
Orogeny.
 Figure
4. Vector "nest" restoring displacements of northern Andean blocks along
faults during Andean orogenesis. Heavy dots denote blocks, tie lines
restore net azimuth and magnitude of fault displacements, moving back in
time. Mérida Andes and Eastern Cordillera deformation is shown
partitioned into strike-orthogonal and strike-parallel components. Figure
4. Vector "nest" restoring displacements of northern Andean blocks along
faults during Andean orogenesis. Heavy dots denote blocks, tie lines
restore net azimuth and magnitude of fault displacements, moving back in
time. Mérida Andes and Eastern Cordillera deformation is shown
partitioned into strike-orthogonal and strike-parallel components.
 Figure
6. Paleogeographic map of western Venezuela and northern Colombia,
showing the position of the Caribbean Plate and main depositional units
during Eocene time. Note the similarity with today's
Persian Gulf. Figure
6. Paleogeographic map of western Venezuela and northern Colombia,
showing the position of the Caribbean Plate and main depositional units
during Eocene time. Note the similarity with today's
Persian Gulf.
Northern
Andes of
Colombia and Western Venezuela
Some
of the principles of kinematic analysis noted above are applied to the
first of our example areas: the northern Andes of Colombia and western
Venezuela. We also will illustrate some of the uses and benefits of this
analysis to petroleum geology and exploration in continental settings.
When
applied to continental areas, kinematic analysis can provide map-view
palinspastic reconstructions of deformed regions prior to the
deformation(s), analogous to balancing cross sections in the vertical
plane. Two very useful applications of continental block kinematics for
exploration are:
·
To allow more accurate plotting of paleofacies for times prior to
deformations.
·
To allow more rigorous reassembly of continental blocks that have
become separated during rifting, thereby enhancing the understanding of
the development of hydrocarbon-bearing continental margins.
Motions and
Pre-Andean Reconstruction
Here
we show a set of simple steps for restoring the northern Andean ranges
and basins for Early Oligocene and earlier time, prior to the majority
of "Andean" deformation. Note that variations in the reconstruction will
derive from applying different numbers of steps (accuracy can be
increased by accounting for more fault motions between more blocks), and
also from adjusting various input parameters, such as magnitudes of
strike-slip offset on certain fault zones.
A
reference frame is needed to begin: In this example, Andean motions are
assessed relative to the Guyana Shield. First, we address the relative
motion of the Maracaibo Block by assessing displacement in the Mérida
Andes, which separate the Maracaibo Block and the Shield.
Figure 3
shows the dextral offset
across the Mérida Andes of the "Eocene thrustbelt," which came to rest
in the Early Oligocene, measured by many as about 150 kilometers. In
addition, shortening in the Mérida Andes has been estimated as about 40
kilometers. Thus, in the Early Oligocene, the Maracaibo Block lay
significantly farther southwest relative to the Shield than it does
today.
In
Figure 4, we construct a tie line between the Guyana Shield and
Maracaibo Block by performing vector addition of the strike-slip (150
kilometers) and thrust (40 kilometers) components. Because we wish to
restore the accrued offset (155 kilometers), we draw the tie lines
opposite to the real-life sense of fault displacements, i.e., moving
back in time.
Having
defined the Oligocene paleoposition of
Maracaibo
relative to the Shield, our next concern is the
Perijá
Range, deformation of which accounts for movements between the Maracaibo
Block and the Santa Marta Massif Block. Estimates of post-Early
Oligocene Perijá shortening are roughly 25 kilometers along an azimuth
of east-southeast/west-northwest, as shown by the Perijá vector in
Figure
2. Thus, displacing Santa Marta Massif to the west-northwest
of
Maracaibo
by 25 kilometers gives the Early Oligocene position of
Santa Marta
relative to both Maracaibo Block and Guyana Shield.
Next,
the Santa Marta strike-slip fault displaces the Santa Marta Massif Block
from the northern part of Colombia's Central Cordillera. Left-lateral
offset of about 110 kilometers (Figures 3 and
4) is believed to have
occurred on this fault zone since the Late Oligocene. This strain is
transferred into the Eastern Cordillera along the south-southeast
continuation of the fault, where it is called the Bucaramanga Fault.
Interestingly, the Bucaramanga Fault is flanked by the high, compressive
topography of Santander Massif; this is because the Bucaramanga Fault
defines the boundary between the Central Cordillera and the Maracaibo
Block, not the Santa Marta Block.
For
simplicity in
Figure
4, the trend shown for the Bucaramanga Fault (in orange)
defines only the total strain between those blocks, i.e. the sum of the
strike-slip and orthogonal components of relative motion.
Finally, we restore Colombia's Guajira Block, also relative to the Santa
Marta Block, by removing about 125 kilometers of dextral shear on the
Oca Fault in order to realign the western flanks of continental basement
in the two blocks prior to fault displacement.
With
just these simple considerations, and assuming that only minor vertical
axis rotation of these blocks has occurred during their relative
motions, we can now fill out other tie lines in the vector "nest" of
Figure
4
to define offsets between other pairs of blocks in the
system. For example, the total strain in the Eastern Cordillera since
the Oligocene is seen to be roughly 200 kilometers toward the
east-southeast (red tie line). This can then be broken down into
components of orthogonal and strike-parallel strain of 180 kilometers
(blue line) and 100 kilometers (green line), respectively, which
translates geologically into shortening (180 kilometers) and dextral
shear (100 kilometers), moving forward in time.
We
note that this value of shortening (180 kilometers) falls in the middle
of the range of published values of estimated shortening in Eastern
Cordillera. Thus, vector nests such as
Figure
4
can be used to help choose between alternative balanced
cross section models assessing shortening, because different assumptions
of depths to detachments or degrees of basement involvement produce very
different modeled shortening values. In addition, it also allows
detection and estimation of the strike-slip component, which usually
cannot be seen in cross sections. Our inferred dextral shear in the
Eastern Cordillera is supported by seismicity, GPS data and field
observations.
A
pre-Andean (i.e., pre-Late Oligocene) palinspastic reconstruction of the
northern Andes continental region (Figure
5) now can be made by restoring the motions of the blocks
defined in Figure
4. The known limit of pre-Mesozoic continental crust has been
identified in
Figure 5 to show the pre-Andean
geometry of the northern Andes "autochthon," to which a number of
oceanic terranes have been accreted in the Cenozoic. Additional
information can now be added to better focus the picture.
We
can, for example, draw the occurrence of Eocene formations, sedimentary
facies and paleoenvironments on our reconstruction in order to build
palinspastically accurate models of regional Eocene depositional
systems. This practice also allows better sequence stratigraphic
interpretation and correlation at the regional scale, which is helpful
to determining migration pathways through the strata.
Also,
the depositional models can be compared more meaningfully to modern
analogues and analyzed for implications concerning reservoir potential,
such as sand body orientation, sinuosity, flow direction, sand grain
provenance and sediment maturity.
Finally, the reconstruction also allows a better interpretation of
Cretaceous source rock character, quality and original areal extent.
Return
to top.
Eocene Foredeep
Using
the same block/plate restoration technique, we can depict Eocene-aged
structures and the Eocene position of the Caribbean Plate relative to
South America, to better understand the driving forces of Eocene
sedimentation patterns and deformation.
Figure 6 thus shows the Caribbean
Plate driving an Eocene foredeep basin in the northern Maracaibo area --
much like today's Persian Gulf -- which caused an important early
hydrocarbon maturation event in western Venezuela and Colombia's Cesar
Basin.
Figure 6
also shows depositional
systems with important reservoir facies belts at the Middle to Late
Eocene boundary, as well as the existence, continuity and origin of an
Eocene "Maracaibo Tar Belt" in western Venezuela (also recognized in
Middle to Late Eocene field sections). The concept of this "textbook"
foredeep basin for the Eocene of Maracaibo Basin had remained darkly
veiled for decades by today's grossly different geography.
Building Quantitative Plate Kinematic Frameworks for Regional
Exploration Assessments
Figure Captions
 Figure
9. Successive pre-Aptian reconstructions of Gondwana and North America,
using the Equatorial Atlantic fit of
Figure
8.
This analysis provides a quantitative framework in which
to build more locally detailed models of the evolution of the Gulf of
Mexico and surrounding areas.
Note pre-Andean/pre-rift restoration of the
northern Andes on the Triassic position of South
America: This defines how much of Mexico is definitely allochthonous
versus how much is potentially -- but not necessarily -- autochthonous. Figure
9. Successive pre-Aptian reconstructions of Gondwana and North America,
using the Equatorial Atlantic fit of
Figure
8.
This analysis provides a quantitative framework in which
to build more locally detailed models of the evolution of the Gulf of
Mexico and surrounding areas.
Note pre-Andean/pre-rift restoration of the
northern Andes on the Triassic position of South
America: This defines how much of Mexico is definitely allochthonous
versus how much is potentially -- but not necessarily -- autochthonous.
Northern Africa
and Northern South America
Plate
kinematics are used to reconstruct
Africa and
South America, and to progressively close the
Atlantic Ocean during Mesozoic times, in order to set the stage for
tracing the evolution of the Gulf of Mexico and the Florida/Bahamas
region. We show the importance of removing post-rift sedimentary
sections and restoring crustal extension when approximating the pre-rift
shapes of continental blocks and margins.
Pre-Aptian Reconstruction
First
we show how this can be done in a simple way, and then we apply the
method to a rifted margin pair -- the equatorial margins of Africa and
South America -- to derive a pre-Aptian reconstruction of the northern
parts of those two continents.
Prior
to the equatorial Atlantic break-up during the Aptian, the northern
parts of these two continents were essentially a single block. We can
use the Euler rotation poles defined by marine magnetic anomalies and
fracture zones in the central North Atlantic to rotate the reconstructed
shape of Africa/South America back toward North America.
This
process, when combined with the pre-Andean palinspastic reconstruction
of the northern Andes described above, provides a quantitative kinematic
framework in which to base models for the Mesozoic evolution of the Gulf
of Mexico, Mexico and nuclear Central America, the Florida/Bahamas
region, the Proto-Caribbean Seaway and northern South America.
Continental rifting reflects divergence of relatively stable portions of
crust. This is accommodated by crustal extension at shallow levels
(typically less than 15 kilometers), by normal faulting and at depth by
ductile stretching of the lower crust and upper mantle. The end result
is lithospheric thinning at the rift; we usually see overall tectonic
subsidence of the surface, elevation of the asthenosphere, increased
heat flow and, sometimes, volcanism.
At the
surface, fault-bounded grabens initially fill with red beds, if
subaerial, as rifting proceeds. These are then overlapped by "thermal
sag" sedimentary sections driven largely by cooling of the asthenosphere,
plus the loading effect of the sediments themselves. Where extension is
sufficiently large, oceanic crust is created and the two portions of
continental crust drift apart. Where rifting does not reach this stage,
we are left with intra-continental basins.
Sediment thickness at the rifted margins that flank ocean basins can
exceed 16 kilometers. If sediment supply is sufficient -- for instance,
near deltas or adjacent to high-relief topography in wet climates -- the
position of passive margin features such as the shelf-slope break can
change significantly with time, growing out from the coast and well
beyond the original limits of the continental crust (Figure
7a). Although used for Bullard's famous reconstruction of the
Atlantic margins (1965), this is why it is not satisfactory in
quantitative kinematic analysis to merely realign a given bathymetric
contour along opposed pairs of passive margins.
Return
to top.
Methodology
To
gain a much closer approximation of the shapes of rifted margins to fit
together for a more precise pre-rift geometry, we must construct cross
sections of rifted margins that depict the thicknesses of the water
column, the sedimentary section, and the crust. Water depth and total
sedimentary section are often known from geophysical studies at passive
margins. The position of the Moho (base of the crust) can be crudely
estimated by the balancing of water, sediment, crust and mantle using
Airy isostatic calculations
(Figures 7b,c) and, where gravity
data or detailed sedimentological data are available, refined by taking
into account crustal flexure and sediment compaction. Once the
cross-sectional shape of the rifted margin's crust is inferred, the syn-rift
extension in basement can be removed by restoring the cross-sectional
area of the rifted margin shoulder back to an unstretched beam of
continental crust.
Again,
a crude calculation can assume this started at or near sea-level, and
more refined calculations could take account of surface elevation, water
depth prior to rifting and variations in initial crustal thickness or
density. This identifies the position within that cross section that
defines the pre-rift edge of the continental block. When plotted at
several points along a particular margin, we can estimate the pre-rift
shape of the continental margins. This can then be rotated towards the
opposing margin using plate kinematic methods to show pre-rift
geological relationships -- and to provide a starting point for modeling
the ensuing basin evolution.
Figure 8
shows the net result of
this method when applied to the rifted margins of the Equatorial
Atlantic. The method is particularly important along the shelves at the
mouths of the Niger and Amazon rivers, where the sedimentary thickness
exceeds 10 kilometers over large areas. Note that the Para-Maranha-
Platform is a piece of the West African Craton stranded on South America
as the Equatorial Atlantic opened. A satisfactory fit can be achieved to
an accuracy of perhaps 50 kilometers.
For
comparison, the inset of
Figure
8
shows the classic Bullard reconstruction of the two
continents, with the pre-rift shapes of basement shown rather than the
2,000-meter isobath employed by Bullard. The inferred underfit in the
Bullard reconstruction approaches 500 kilometers. Because continental
reassembly in the
Gulf of Mexico region is achieved by rotating the Africa-South America
reconstruction back toward
North America using
Central Atlantic kinematic data, the difference between the two approaches will
affect the final reassembly as profoundly as any other kinematic
parameter.
Marine
magnetic anomalies and fracture zone traces are used in the oceans to
track the past velocity and flowpath, respectively, of pairs of plates
separated by seafloor spreading.
Reconstruction
Figure
9 shows a series of reconstructions of our united Africa-South America
supercontinent and North America for Aptian and older times, prior to Equatorial Atlantic break up.
Some of the positions are interpolated or extrapolated from the marine
data to provide key time slices such as Triassic Pangean continental
closure, and late Callovian/Early Oxfordian salt deposition in the Gulf.
The analysis tells us how fast and in what direction the continents
separated, which in turn constrains the geometry of ridge systems
between the
Americas, and also the size and shape of the inter-American gap through
time.
Finally, also shown on
Figure
9
is the pre-rift palinspastic shape of the northern
Andes region superimposed on
South America
for the Late Triassic time slice. This was drawn by taking pre-Andean
reconstruction (i.e. prior to Cenozoic shortening and strike-slip) and
modifying it for pre-rift time by applying the methodology of
Figure
7
(assuming an ENE-WSW extension direction).
The
relationship of North and
South America at this time is important, because it defines a line separating
two parts of
Mexico.
The part of Mexico overlapped during Late Triassic time by
South America must have migrated into today's position as a function of
Gulf
of Mexico evolution, Cordilleran terrane migration, and/or Sierra
Madre/Chiapas shortening history. Parts of Mexico not overlapped by
South America during the Triassic may have been in place relative to
today's geography, but were not necessarily so.
From
Figure
9, the fact that the formation of the Gulf of Mexico was
completed by early Cretaceous time implies that Jurassic plate boundary
systems active in the Gulf until then probably also controlled many
primary elements of the evolution of Mexico. The kinematic constraints
developed here may now may be used to reconstruct western Pangea and to
trace the Mesozoic plate-kinematic evolution of the Gulf of Mexico,
eastern Mexico, the Florida/Bahamas region and the Proto-Caribbean
Seaway.
Reconstruction
of Gulf of Mexico Region
Figure
Captions
 Figure
10. Present day map of the Gulf of Mexico region, showing key geological elements addressed in this month’s
article.
Note the abrupt terminations of known basement units in
southern
Florida that we consider were truncated by transcurrent motion on our
"Everglades Fracture Zone." Also note the change in trend of East
Mexican Marginal Fault Zone supporting the concept of two stages of Gulf
evolution; basement structure contour data preclude any east-west faults
in Mexico from entering the Gulf during the sea-floor spreading stage.
Digital bathymetry/relief after Sandwell and Smith (1997), other
features from multiple sources. Figure
10. Present day map of the Gulf of Mexico region, showing key geological elements addressed in this month’s
article.
Note the abrupt terminations of known basement units in
southern
Florida that we consider were truncated by transcurrent motion on our
"Everglades Fracture Zone." Also note the change in trend of East
Mexican Marginal Fault Zone supporting the concept of two stages of Gulf
evolution; basement structure contour data preclude any east-west faults
in Mexico from entering the Gulf during the sea-floor spreading stage.
Digital bathymetry/relief after Sandwell and Smith (1997), other
features from multiple sources.
 Figure
11. Early Cretaceous (Valanginian) reconstruction of the Gulf of Mexico
and Proto-Caribbean region. Post-Gulf formation stage, when seafloor
spreading in the Gulf had ceased but was continuing in the
Proto-Caribbean seaway. Figure
11. Early Cretaceous (Valanginian) reconstruction of the Gulf of Mexico
and Proto-Caribbean region. Post-Gulf formation stage, when seafloor
spreading in the Gulf had ceased but was continuing in the
Proto-Caribbean seaway.
 Figure
12. Late Jurassic (Early Oxfordian) reconstruction of the Gulf of Mexico
and Proto-Caribbean region ("salt fit"). Onset of seafloor-spreading
stage. Note that Chiapas Massif has been transferred to Yucatan Block at
this time.
Also, bulk strain direction in
Mexico
shifts from ESE-ward to S-ward at this time, with the opening of the
Mexican back-arc basin. Figure
12. Late Jurassic (Early Oxfordian) reconstruction of the Gulf of Mexico
and Proto-Caribbean region ("salt fit"). Onset of seafloor-spreading
stage. Note that Chiapas Massif has been transferred to Yucatan Block at
this time.
Also, bulk strain direction in
Mexico
shifts from ESE-ward to S-ward at this time, with the opening of the
Mexican back-arc basin.
 Figure
13. Jurassic reconstruction of the Gulf of Mexico and Proto-Caribbean region. Onset of "syn-rift" stage. Figure
13. Jurassic reconstruction of the Gulf of Mexico and Proto-Caribbean region. Onset of "syn-rift" stage.
Click here for sequence of
Early Cretaceous, Late Jurassic, and Early
Jurassic reconstructions (Figures 11, 12, and 13) along with
present-day map of Gulf of Mexico (Figure
10).
Return
to top.
Evolution of Region
Using
the kinematic framework for the evolution of the
Gulf of Mexico
region defined by restoring Andean deformations and progressively
closing the Atlantic Ocean, we further evolve it to build a
palinspastically quantitative reassembly of continents and continental
blocks that were separated during the Mesozoic rifting and subsequent
drift in the Gulf of Mexico region. Key features are shown in Figure
10. Figures 11, 12, and
13 show primary developmental stages
in the evolution of the Gulf:
Kinematic Elements in Reconstruction
The
kinematic elements applicable to the reconstructions are as follows.
First,
our Oligocene reconstruction of northern South America (article two) is
further modified for Late Jurassic and Cretaceous time by removing
island arc and other terranes that were accreted to in the Late
Cretaceous and Early Tertiary (shape portrayed in Figures
11 and
12). We can then estimate and restore Jurassic
extension in the rift basins of the Andes (using principles outlined in
the August EXPLORER, which gives us an Early Jurassic shape for the
northern Andes that can be closed against North America (Figure
13).
Second,
Figures 11, 12, and 13 show that the entire region of
Florida,
the Blake Plateau and the Bahamas (and the "Cuban autochthon" beneath
the Cuban arc) were strongly controlled by fracture zone trends of the
early
Atlantic.
In
this region, plate separation was achieved by NW-SE stretching of
crustal elements separated by transcurrent faults. Middle Jurassic
basalt extrusion was commonplace in zones of high stretching. Each
crustal "corridor" between transcurrent faults underwent different
amounts of stretching and displacements relative to the others. The
conjugate margin to the Southern Bahamas flank is the transcurrent
margin of
Guyana.
Third,
unlike the Florida region, the Yucatan Block moved independently -- in
two distinct stages -- of the larger continents as the Gulf opened. At
the time of
Figure
13, there is only a small range of paleo-positions in which
Yucatan could have fit geometrically without overlap of palinspastically
restored (i.e., rift-related stretching removed) areas of continental
crusts. This position can be achieved by rotating present-day Yucatan
clockwise about "pole A" (Figure
13), which closes most of the Gulf by placing
Yucatan snugly against the northeast
Mexico-Texas-northwest
Florida paleo-margin. It definitely does not,
however, close the southeastern Gulf. There, the crust of
South
Florida -- including that of the "Tampa Arch" -- must be retracted
northwestward against Yucatan and out of an overlap position with
Demerara Rise, off the Guyana margin. Thus, the southernmost crustal
corridor of the Bahamas must have migrated SE, probably along our
"Everglades Fracture Zone" (Figure
10) between the times of
Figures
12 and
13.
Fourth,
the geology of the eastern Mexican margin and the occurrence of Louann
and Campeche salt suggest that the Gulf opened in two stages.
The
first, or syn-rift, stage -- between the times of
Figures
12
and 13 -- involved intra-continental stretching between
Yucatan and North America about "pole B1," and between Yucatan and South
America about "pole B2," in
Figure
13. This migration defined an arcuate transcurrent trend
defined by basement contours along the northern Tamaulipas Arch in south
Texas. It also created a sinistral shear
couple in the Louisiana-Mississippi area, which allowed for minor
counterclockwise rotation of the Wiggins and Middle Grounds arches (Figures
10 and 13) and the associated formation of the wedge shaped
East Mississippi and Apalachicola salt basins to the north of each,
respectively.
This
syn-rift stage about "pole B1" can be modeled satisfactorily to Early
Oxfordian time to achieve a good reconstruction of the Louann and
Campeche salt provinces flanking the central Gulf (Figures
10
and 12). In our modeling, we see no need to invoke
significant salt deposition on oceanic crust in the Gulf. Also, during
this stage, the southern Bahamas crustal corridor migrated southeast in
addition to undergoing internal stretching -- hence, the Everglades
fracture zone and the Guyana marginal fault zone were both active at
this time.
The
migration of Yucatan from its pre-rift to its present position requires
that eastern Mexico was a transform rather than a rifted margin. We
consider that Yucatan did not have the Chiapas Massif attached to it
during the syn-rift phase. Why?
-
First, we cannot
satisfactorily fit a combinedYucatan/Chiapas Massif into the northern
Gulf, especially when we reverse the effect of Cenozoic shortening in
Sierra de Chiapas.
-
Second, we believe that the
Chiapas syn-rift salt basin is best explained by early transtension
along a crustal scale fault beneath it.
The
second stage of Yucatan motion began about "pole C" of
Figure
12, in the Early Oxfordian,
at the end of salt deposition. This second stage of motion and its pole
of rotation are constrained by:
-
Geophysical data along the
eastern Mexican margin, which show an abrupt NNW-SSE trending
ocean-continent boundary.
-
Magnetic anomaly data in
the eastern Gulf.
-
Displacement of the
once-adjacent margins of the Louann and Campeche salt basins.
We
believe that the Chiapas Massif was picked up by Yucatan in this stage
as a consequence of the onset of seafloor spreading in the Central Gulf
-- and because the pole of rotation changed in Stage 2, the orientation
and position of transforms also must have changed. This new phase of
motion had a more southerly direction than the previous one. The
spreading ridge almost reached the Mexican coast and, hence, the new
transform along eastern Mexico would have picked up an additional wedge
of crust, which we believe is Chiapas Massif and which had been emplaced
there during the syn-rift phase by sinistral transcurrent motions within
greater Mexico.
As
with the Gulf of Mexico, the synchronous creation of the "Proto-Caribbean
Basin"
also must have involved a rotational opening between Yucatan and
Venezuela-Trinidad. In Figures 11, 12, and
13, we show the approximate
flowlines along which this basin opened, as well as a hypothetical
geometry of its Jurassic rifted margins -- now wholly overthrust by
allochthonous Caribbean terranes.
Return
to top.
Relation to Hydrocarbon Potential
Many
elements of northern
South America's and possibly eastern
Yucatan's hydrocarbon potential pertain directly to the geometries of
these rifted margins, such as the positions of marginal re-entrants that
define differing stratigraphic sequences due to differing subsidence
histories. Our working Gulf kinematic model has some interesting
implications for exploration.
First,
the Eastern Mexican margin (unlike that of
Texas) was a Jurassic fracture zone in the
north (Burgos-Tampico basins) and a transform -- with active structuring
until its Early Cretaceous death -- in the south (Veracruz
Basin). Heat flow, subsidence history, occurrence of salt,
distribution/thickness of Late Jurassic source rocks and basement
controls on future structural development will all vary along strike
along this margin due to differing crustal properties and histories. In
the U.S. Gulf margins, early syn-rift stretching was NNW-SSE until Early
Oxfordian times, but most of the stretching toward the end of this phase
occurred well offshore.
Second,
although salt deposition is generally assumed to be of Callovian age,
there is little evidence of open marine conditions in the Gulf margins
until upper Oxfordian (Norphlet-Smackover transition), and thus salt
deposition may have continued until Early Oxfordian. Our Early Oxfordian
reconstruction accommodates known salt occurrence in the Gulf ("salt
fit"); hence, we consider that onset of seafloor spreading, the change
in the Yucatan-North America pole position, separation of Louann and
Campeche salt provinces, and initiation of open marine conditions were
nearly coeval and possibly causally related.
Third,
although the syn-rift stretching of the Florida Shelf region was NW-SE,
the extension direction in the deep eastern Gulf during stage 2
(seafloor spreading) was NE-SW about a nearby pole, such that small
circles (transform traces) should be arcuate and convex to the
northwest. In Cuba, a significant area of Bahamian crust was overthrust
by Cuban arc assemblages in the Paleogene. In the Jurassic, the southern
Bahamian margin (beneath Cuba) experienced sinistral strike-slip
tectonics along the Guyana margin of South America, followed by the
eastward migration of a Late Jurassic seafloor spreading ridge
(Yucatan/South America boundary) along the western half of the
overthrust zone.
The
transform nature of this Jurassic margin should be considered in
interpretations of the Paleogene development of the Cuban thrust belt,
Mesozoic source rock paleogeography and oil migration pathways during
Eocene maturation. In the Proto-Caribbean, the kinematics require
westward-propagating Early and Middle Jurassic rifting, followed by Late
Jurassic seafloor spreading. The trends of marginal re-entrants such as
that defined by the Urica basement transfer zone are defined by the
first stage of Yucatan's motion.
Further, Venezuela-Trinidad's passive margin section is predicted to
have existed from the end of Middle Jurassic, not Cretaceous as is
commonly thought. A several kilometer-thick, probable Late Jurassic
shelf section in Eastern Venezuela has not received much attention from
exploration, and the "Berriasian or older" salt in Gulf of Paria could
be Middle Jurassic (as is the salt in the Bahamas, Guinea Plateau and
Demerara Rise and Tacatú Basin). Note the proximity of these areas on
Figure 13. In Sierra Guaniguanico of
western Cuba, the conjugate margin of Eastern Venezuela, the lower
Middle Jurassic San Cayetano strata indicate the existence of a juvenile
passive margin of that age, becoming fully marine for Late Jurassic, as
predicted here for Venezuela and Trinidad.
Summary
In
summary, regional plate kinematic analysis is extremely cost-effective
and deserves an important role in the exploration of complex areas, both
early on and long-term. The kinds of implications we have drawn here
also can be made from kinematic analysis in other parts of the world.
When applied properly to appropriate areas, it is not arm waving. Much
can be gleaned about:
-
Fault styles and
displacements.
-
Basement types and
associated parameters such as early heat flow.
-
Systematics of regional
reservoir-bearing depositional patterns.
-
The relative ages of
classes of structures, etc.
And all that is gleaned can lead to the creation or dismissal of
numerous play concepts. In addition, an explorationist with a
comprehensive kinematic framework available to him or her will work more
confidently -- and therefore, more efficiently -- on nearly all other
aspects of the exploration process. Finally, in frontier evaluation
programs, regional kinematic analysis may not tell you exactly where to
drill, but it can often help to tell you where not to drill.
Return
to top.
|
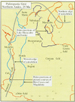 Figure 5. Oligocene reconstruction of pre-Mesozoic continental basement,
northern Andes, based on vector displacements from
Figure 5. Oligocene reconstruction of pre-Mesozoic continental basement,
northern Andes, based on vector displacements from Figure 7. a. Cartoon section showing how passive margin sediments
(deltas, turbidites, carbonate banks) can prograde far beyond the
original position of the continental edge.
Figure 7. a. Cartoon section showing how passive margin sediments
(deltas, turbidites, carbonate banks) can prograde far beyond the
original position of the continental edge.