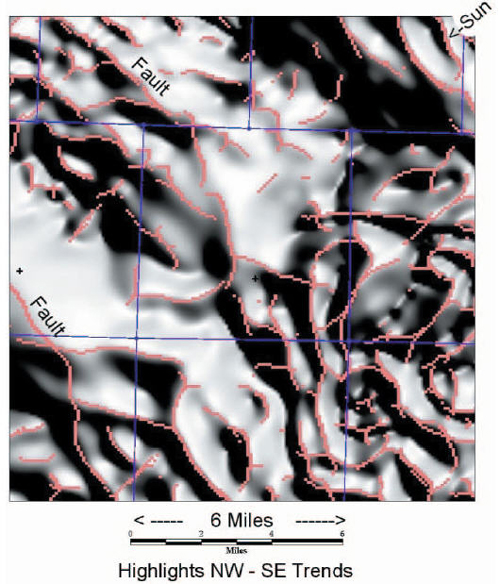
Figure 3.Shaded-relief image of horizontal derivative amplitude of the 5,000-6,000-foot depth-sliced, reduced-to-pole magnetic intensity. The sun in the northeast illuminates several northwest fault trends. Orange lines are AUTOFAULT picks of faults within Rulison Gas Field.