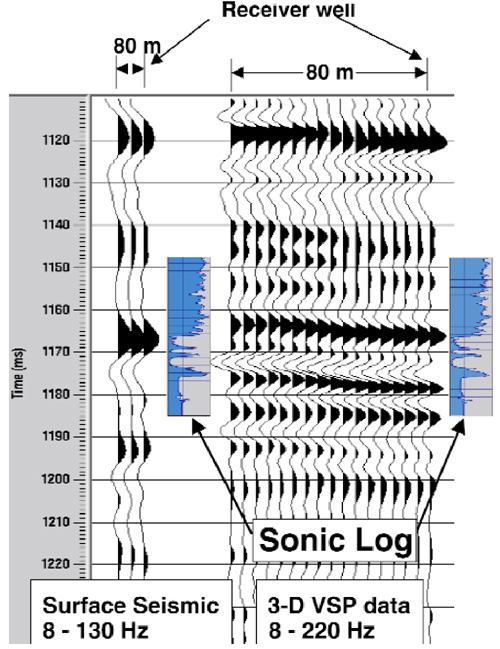
Figure 5. This is a comparison of the image obtained from surface seismic data and borehole seismic data. The surface data was recorded simultaneously with the borehole data using the same dynamite shots. The image on the left is from the surface seismic data at the receiver well. The data has a 40 m CDP spacing. The image on the right was generated from the borehole seismic data and covers exactly the same time range and location as the surface seismic image. The frequency content of the borehole seismic is about twice that of the surface seismic and the spatial sampling of the borehole seismic is 5 times greater than the surface seismic which allows for detailed imaging of lateral changes in the reservoir properties.