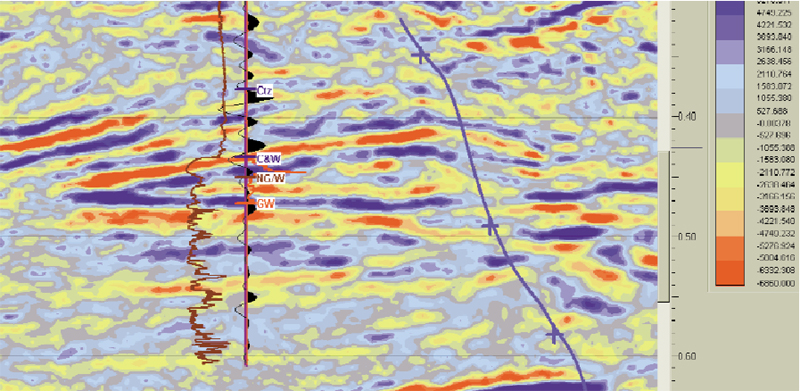
Figure 4. Two-D seismic line acquired prior to primary production. Note strong trough (red) amplitude anomaly at top of Clark and Wilson Sandstone (C&W), and strong, flat peak (blue) amplitude anomaly at the gas-water contact (GW). (Figure published with permission of BP.)