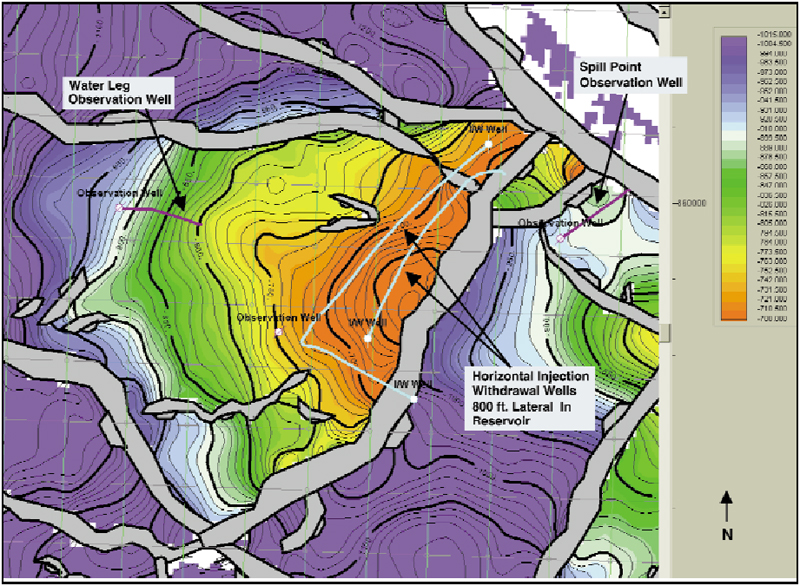
Figure 1. Subsea structure map to top of reservoir sandstone. The map was created by multiplying the time structure map, as interpreted from the 3-D data set, by the velocity gradient map. Color transition from white to green represents the pool’s original gas/water contact. Grid distance is 400 feet on a side.