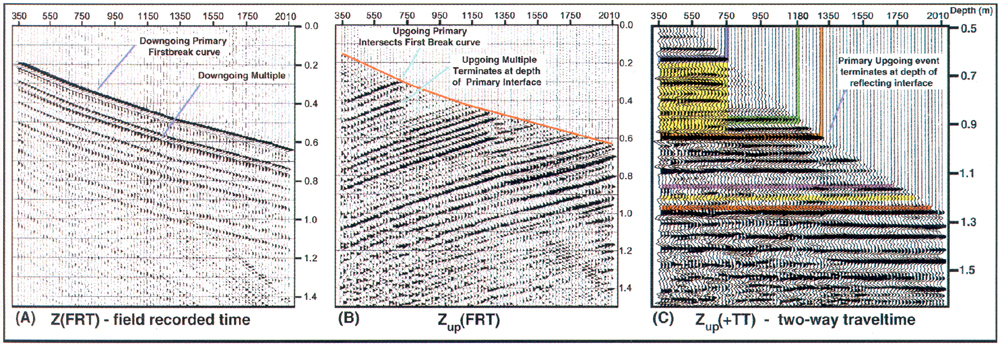
Figure 3. The full wavefield (both up- and downgoing events) zero-offset VSP data in (A) shows high amplitude downgoing events. The upgoing events in (B) can only be seen easily after wavefield separation (downgoing waves are isolated and subtracted out of the data). In (C), the upgoing events are aligned in two-way traveltime (+TT) and can be tied to the surface seismic stacked section. The upgoing event colored orange intersects the first break curve at the trace representing the depth of the interface which caused the reflection.