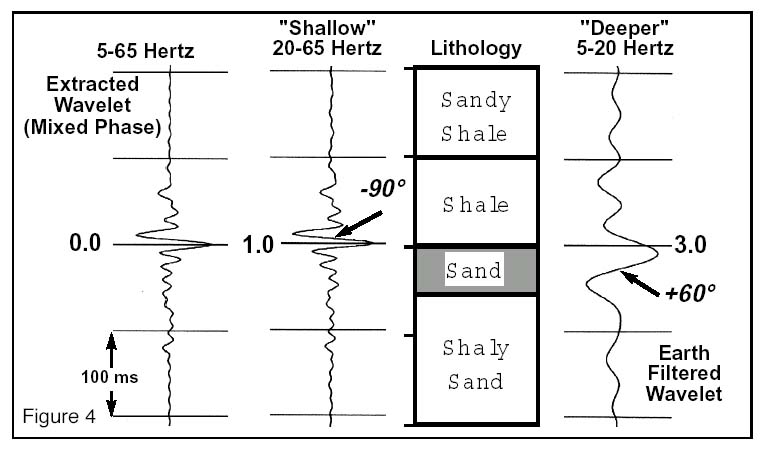
Figure 4: Seismic data containing this mixed-phase wavelet will display a changing peak trough relationship (-90 degrees to +60 degrees) and time shift (linear phase) due to the earth’s attenuation of higher frequencies with depth. For simplicity, the waveforms shown here are only for the top sand reflector.