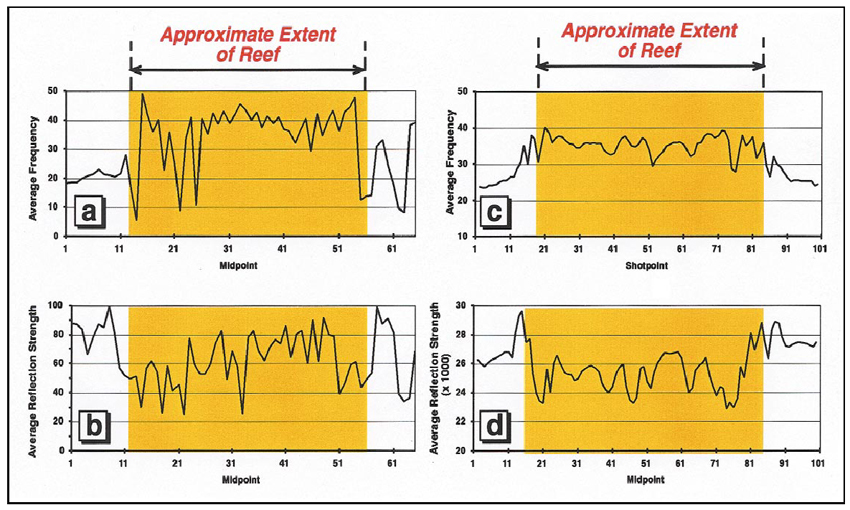
Figure 4. Comparison of seismic attributes derived from data shown in Figure 2c with seismic attributes derived from model results shown in Figure 2b. a. Average frequency between the top and base of the Smackover from the data. b. Average reflection strength between those same two markers from the data. c. Average frequency between the top and base of the Smackover from the model results. d. Average reflection strength between those same two markers from the model results. In both cases, average frequency for the Smackover is higher and average reflection strength is lower where the porosity zone is present beneath the reef crest.