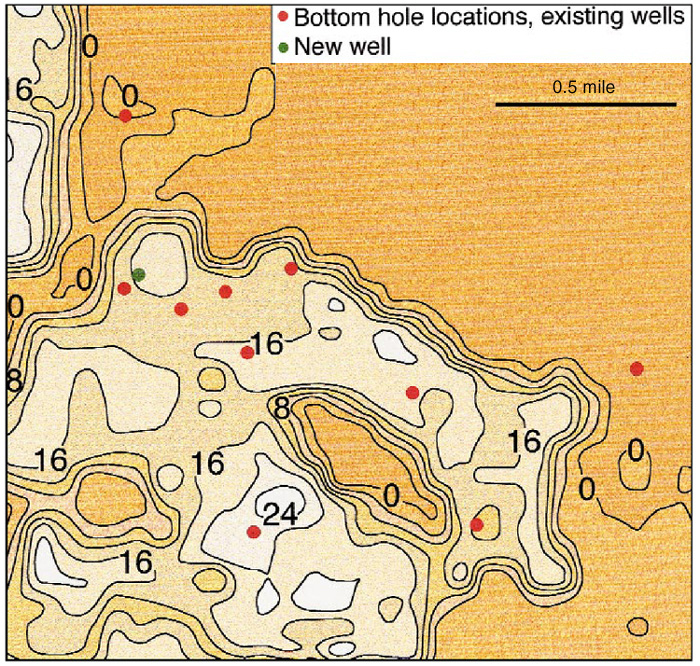
Figure 3. Attribute-based map of the thickness of the porosity zone in the area of the Appleton Field. Contours in meters. Bottomhole location of well drilled following this study shown by green dot.
Figure 3. Attribute-based map of the thickness of the porosity zone in the area of the Appleton Field. Contours in meters. Bottomhole location of well drilled following this study shown by green dot.