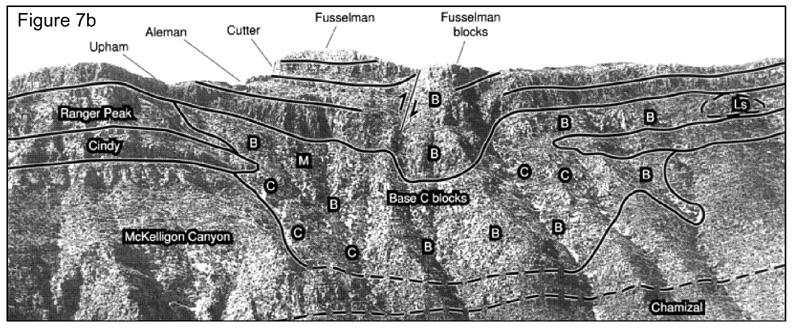
Figure 7b. Same area interpreted, showing distribution of collapse breccia and the collapse of the Ordovician Montoya Group into the Ranger Peak Formation. (B=breccia, C=blocks of Cindy Formation, M=blocks of Montoya Group.)
Click here to view sequence of uninterpreted (Figure 7a) and interpreted photograph.