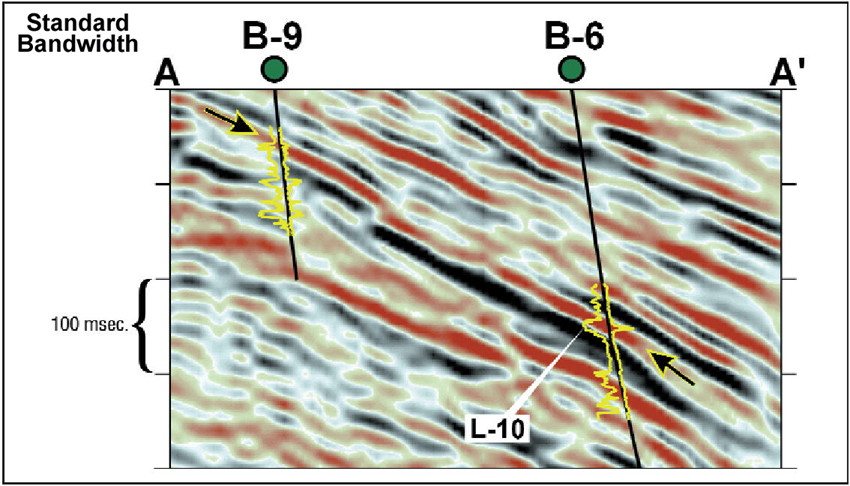
Figure 4. Standard bandwidth 3-D arbitrary profile (A-A') connecting the B-9 and B-6 wells. Arrows indicate the reflector under investigation. SP log tracts appear to the left of well bore projections with resistivity to the right. Red represents negative reflection coefficients on the seismic color bar.