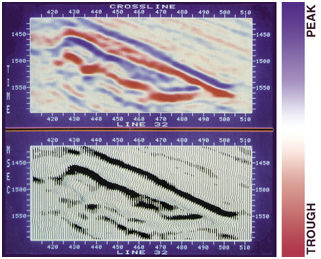
Figure 1. Vertical seismic section displayed with gradational blue for peaks and gradational red for troughs, compared to same section (below), displayed in variable area/wiggle trace.
Figure 1. Vertical seismic section displayed with gradational blue for peaks and gradational red for troughs, compared to same section (below), displayed in variable area/wiggle trace.