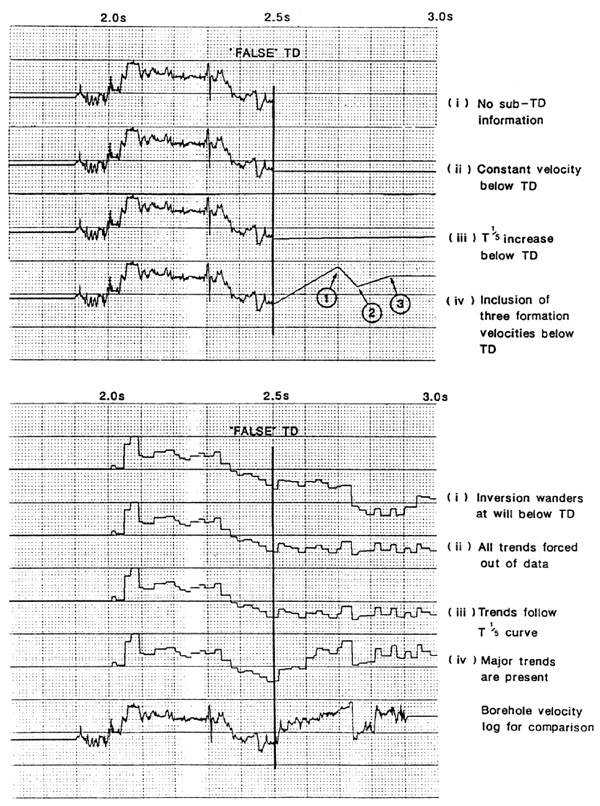
Figure 3. Effects of different velocity trends applied below TD of a well. Top panel represents available choices for handling velocity below TD. Bottom panel shows resultant impedance log below TD with actual sonic log for comparison.
Figure 3. Effects of different velocity trends applied below TD of a well. Top panel represents available choices for handling velocity below TD. Bottom panel shows resultant impedance log below TD with actual sonic log for comparison.