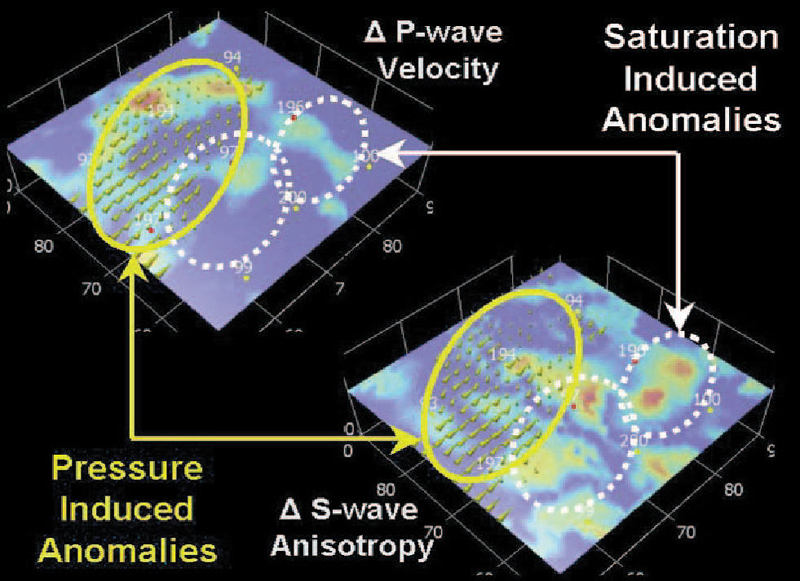
Figure 4. Phase II seismic anomalies. The upper diagram shows the time-lapse P-wave velocity differences while the lower diagram shows the time-lapse S-wave velocity anisotropy differences. Overlain on each diagram are the S-wave polarization direction differences (areas that have changes in the S-wave polarization direction). Areas of the reservoir that have P-wave velocity and S-wave polarization direction anomalies correspond to zones of the reservoir with pressure changes. Areas of the reservoir that have S-wave anisotropy anomalies correspond to zones with fluid saturation changes.