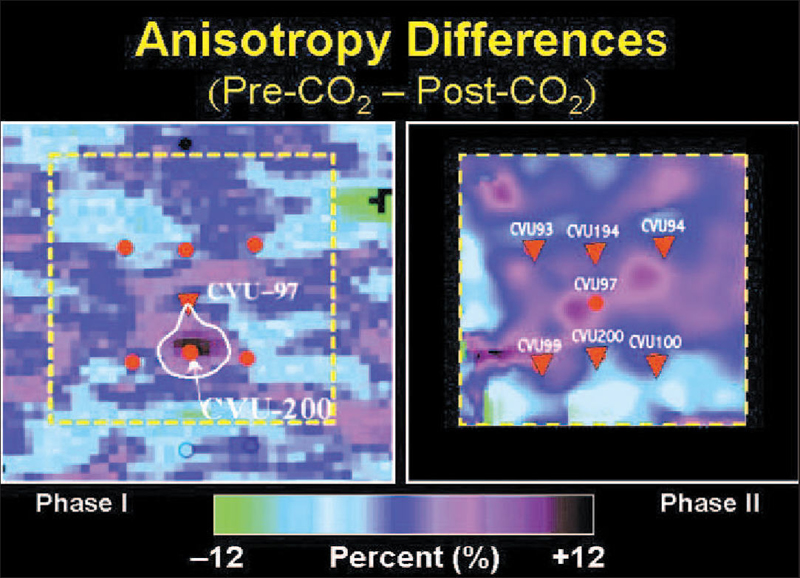
Figure 3. Time-lapse shear-wave velocity anisotropy differences. Phase I) CO2 injection occurred at the CVU-97 well with a prominent S-wave anisotropy anomaly detected to the south. Phase II) CO2 injection occurred at the six offset injectors (indicated by triangles). In the case of the miscible CO2-oil bank, the S2 velocity increased and S1 velocity decreased (purple), whereas, in the case of water injection, the change in effective stress causes the S2 velocity to decrease and S1 velocity to increase (blue).