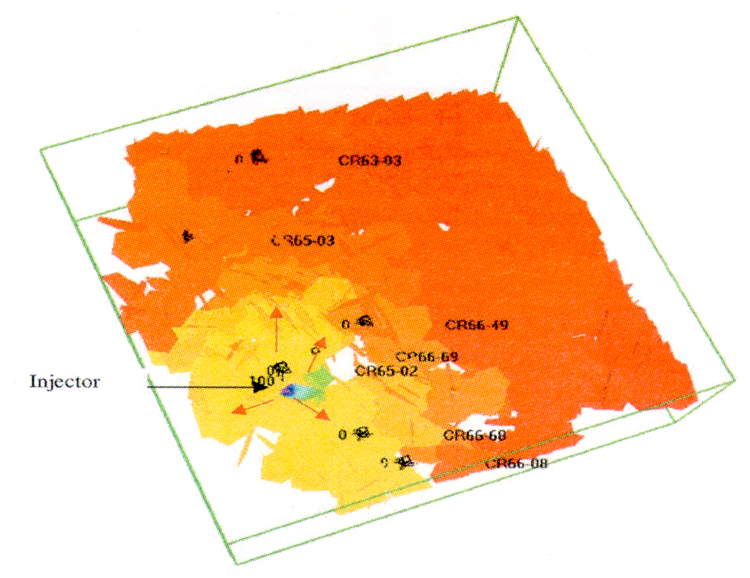
Figure 9. Snapshot of pressure in the fractures after injection. The colors indicate the pressure variations in the network (Blue colors indicate high pressure, orange indicates low pressure). Orange arrows show direction of flow out from the injector into the fracture network.