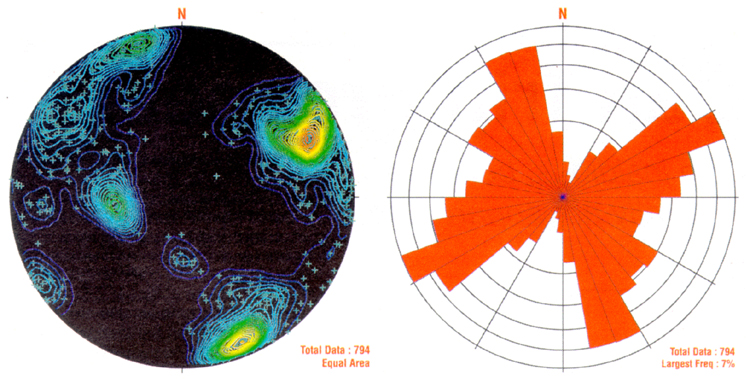
Figure 3. Auto-detected fractures from the Mt. Lemmon dataset (N = 794) plotted as poles on a lower-hemisphere stereonet (left) and rose diagram (right). The results compare favorably with scanline data from the same outcrop. Note that only relatively large-area fractures are plotted here.