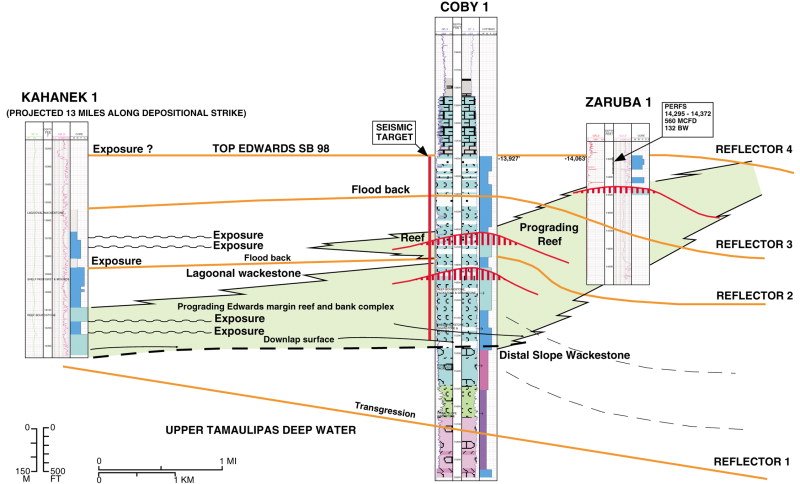
Figure 10--Cross section showing Edwards facies relations among three wells. The line of section is the same as that of the seismic line of Figure 9; the location is shown on Figure 7. The Mobil 1 Kahanek well is projected in from Word field. The SP log is shown to the left of the depth track (in feet), and a resistivity log is shown to the right. Conventional core was described from approximately 13,670 to 14,340 ft (4169 to 4373 m). The rock types recognized in the core are summarized in the right column; boundstones and packstones, from approximately 14,100 ft (4300 m) to the bottom of the core, are overlain by packstones and grainstones. Gamma-ray (left) and sonic (right) logs are shown for the Chevron 1 Coby well. Facies recognized during drill cuttings examination from 14,200 to 16,000 ft (4331 to 4880 m) in the Edwards (see Figure 8) are shown in the right column. Gamma-ray (left) and resistivity (right) logs are shown for the Exxon 1 Zaruba well. A core description from approximately 14,280-14,500 ft (4355-4422 m) is summarized in the right column; grainstones and packstones overlie boundstones at the base of the core. Seismic sequence boundaries (reflectors 1-4) are the basis for the correlation between the wells. The highly progradational nature of an Edwards margin reef and bank complex is shown to extend the ultimate Edwards margin more than 3 mi (4.8 km) seaward of the Word field trend.