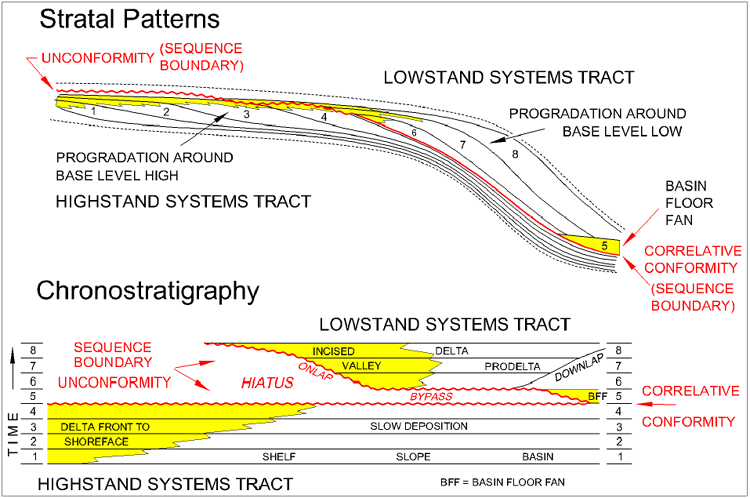
Figure 2. Strata1 patterns and chronostratigraphy according to the standard Exxon sequence-stratigraphic model. For simplicity, the transgressive systems tract has been represented as a maximum flooding surface. The flat base of the sequence boundary hiatus (time not represented by rock volume) corresponds to the abrupt basinward shift in the shoreline position. The “age” of the sequence boundary is designated by the correlative conformity. According to the model, there is one unique correlative conformity for each sequence boundary, and all strata below the sequence boundary are older than all strata above the sequence boundary. Modified from Edwards (1995h).