Print this page
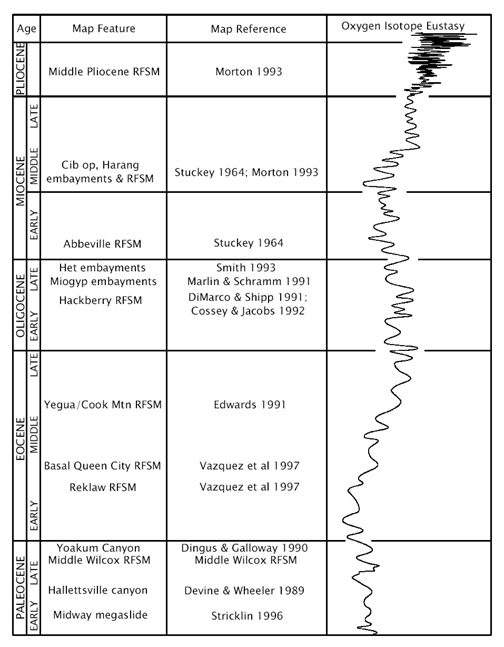
Figure 10. Distribution in time of the features shown in Figure 9. Position in time is approximate. As a proxy for sea level, the reconstructed oxygen isotope curve of Abreu and Anderson (1998) is shown.